Fatal Errors
Overview
In certain situations, the execution of the program can not be continued in a well-defined way. In ESP-IDF, these situations include:
CPU Exceptions: Illegal Instruction, Load/Store Alignment Error, Load/Store Prohibited error.
System level checks and safeguards:
Interrupt watchdog timeout
Task watchdog timeout (only fatal if CONFIG_ESP_TASK_WDT_PANIC is set)
Cache access error
Memory protection fault
Brownout detection event
Stack overflow
Stack smashing protection check
Heap integrity check
Undefined behavior sanitizer (UBSAN) checks
Failed assertions, via
assert,configASSERTand similar macros.
This guide explains the procedure used in ESP-IDF for handling these errors, and provides suggestions on troubleshooting the errors.
Panic Handler
Every error cause listed in the Overview will be handled by the panic handler.
The panic handler will start by printing the cause of the error to the console. For CPU exceptions, the message will be similar to
Guru Meditation Error: Core 0 panic'ed (Illegal instruction). Exception was unhandled.
For some of the system level checks (interrupt watchdog, cache access error), the message will be similar to
Guru Meditation Error: Core 0 panic'ed (Cache error). Exception was unhandled.
In all cases, the error cause will be printed in parentheses. See Guru Meditation Errors for a list of possible error causes.
Subsequent behavior of the panic handler can be set using CONFIG_ESP_SYSTEM_PANIC configuration choice. The available options are:
Print registers and reboot (
CONFIG_ESP_SYSTEM_PANIC_PRINT_REBOOT) — default option.This will print register values at the point of the exception, print the backtrace, and restart the chip.
Print registers and halt (
CONFIG_ESP_SYSTEM_PANIC_PRINT_HALT)Similar to the above option, but halt instead of rebooting. External reset is required to restart the program.
Silent reboot (
CONFIG_ESP_SYSTEM_PANIC_SILENT_REBOOT)Do not print registers or backtrace, restart the chip immediately.
Invoke GDB Stub (
CONFIG_ESP_SYSTEM_PANIC_GDBSTUB)Start GDB server which can communicate with GDB over console UART port. This option will only provide read-only debugging or post-mortem debugging. See GDB Stub for more details.
Note
The CONFIG_ESP_SYSTEM_PANIC_GDBSTUB choice in the configuration option CONFIG_ESP_SYSTEM_PANIC is only available when the component esp_gdbstub is included in the build.
The behavior of the panic handler is affected by three other configuration options.
If CONFIG_ESP_DEBUG_OCDAWARE is enabled (which is the default), the panic handler will detect whether a JTAG debugger is connected. If it is, execution will be halted and control will be passed to the debugger. In this case, registers and backtrace are not dumped to the console, and GDBStub / Core Dump functions are not used.
If the Core Dump feature is enabled, then the system state (task stacks and registers) will be dumped to either Flash or UART, for later analysis.
If CONFIG_ESP_PANIC_HANDLER_IRAM is disabled (disabled by default), the panic handler code is placed in flash memory, not IRAM. This means that if ESP-IDF crashes while flash cache is disabled, the panic handler will automatically re-enable flash cache before running GDB Stub or Core Dump. This adds some minor risk, if the flash cache status is also corrupted during the crash.
If this option is enabled, the panic handler code (including required UART functions) is placed in IRAM, and hence will decrease the usable memory space in SRAM. But this may be necessary to debug some complex issues with crashes while flash cache is disabled (for example, when writing to SPI flash) or when flash cache is corrupted when an exception is triggered.
If CONFIG_ESP_SYSTEM_PANIC_REBOOT_DELAY_SECONDS is enabled (disabled by default) and set to a number higher than 0, the panic handler will delay the reboot for that amount of time in seconds. This can help if the tool used to monitor serial output does not provide a possibility to stop and examine the serial output. In that case, delaying the reboot will allow users to examine and debug the panic handler output (backtrace, etc.) for the duration of the delay. After the delay, the device will reboot. The reset reason is preserved.
The following diagram illustrates the panic handler behavior:
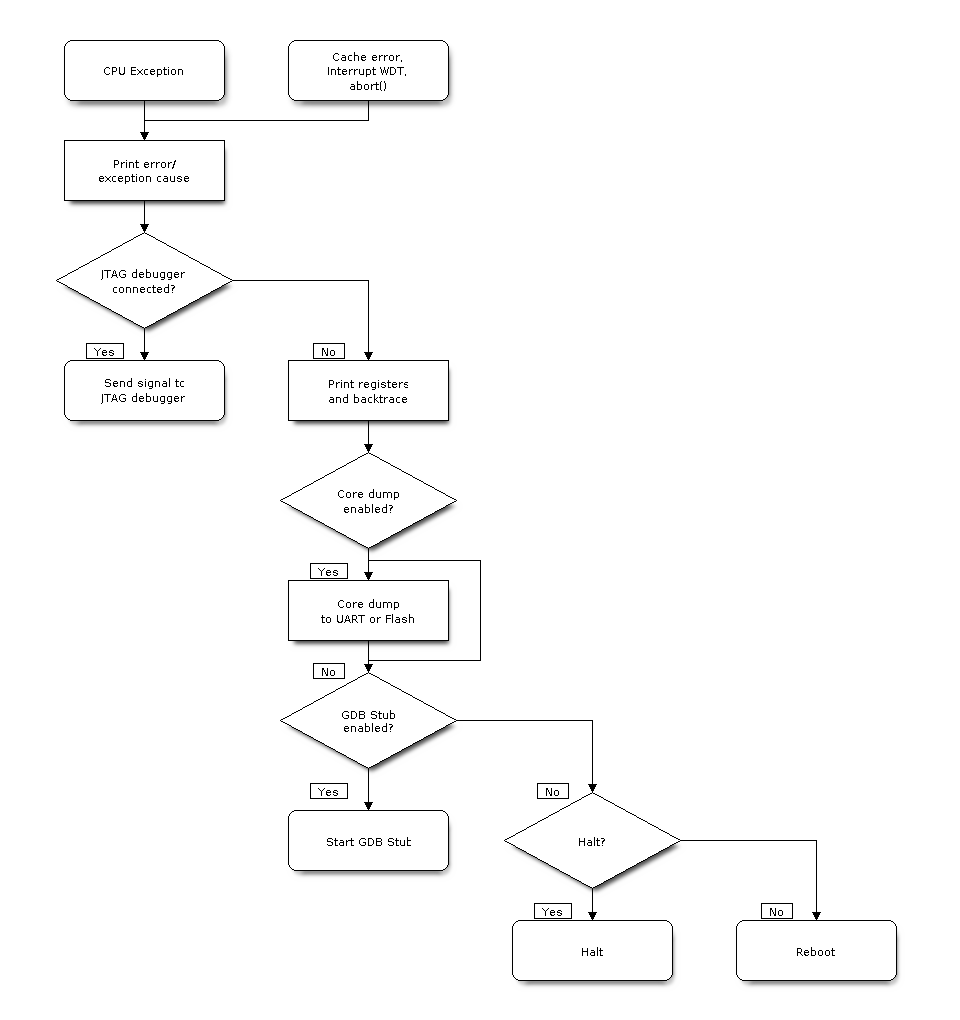
Panic Handler Flowchart (click to enlarge)
Register Dump and Backtrace
Unless the CONFIG_ESP_SYSTEM_PANIC_SILENT_REBOOT option is enabled, the panic handler prints some of the CPU registers, and the backtrace, to the console.
Core  0 register dump:
MEPC    : 0x420048b4  RA      : 0x420048b4  SP      : 0x3fc8f2f0  GP      : 0x3fc8a600
TP      : 0x3fc8a2ac  T0      : 0x40057fa6  T1      : 0x0000000f  T2      : 0x00000000
S0/FP   : 0x00000000  S1      : 0x00000000  A0      : 0x00000001  A1      : 0x00000001
A2      : 0x00000064  A3      : 0x00000004  A4      : 0x00000001  A5      : 0x00000000
A6      : 0x42001fd6  A7      : 0x00000000  S2      : 0x00000000  S3      : 0x00000000
S4      : 0x00000000  S5      : 0x00000000  S6      : 0x00000000  S7      : 0x00000000
S8      : 0x00000000  S9      : 0x00000000  S10     : 0x00000000  S11     : 0x00000000
T3      : 0x00000000  T4      : 0x00000000  T5      : 0x00000000  T6      : 0x00000000
MSTATUS : 0x00001881  MTVEC   : 0x40380001  MCAUSE  : 0x00000007  MTVAL   : 0x00000000
MHARTID : 0x00000000
The register values printed are the register values in the exception frame, i.e., values at the moment when the CPU exception or another fatal error has occurred.
A Register dump is not printed if the panic handler has been executed as a result of an abort() call.
If IDF Monitor is used, Program Counter values will be converted to code locations (function name, file name, and line number), and the output will be annotated with additional lines:
Core  0 register dump:
MEPC    : 0x420048b4  RA      : 0x420048b4  SP      : 0x3fc8f2f0  GP      : 0x3fc8a600
0x420048b4: app_main at /Users/user/esp/example/main/hello_world_main.c:20

0x420048b4: app_main at /Users/user/esp/example/main/hello_world_main.c:20

TP      : 0x3fc8a2ac  T0      : 0x40057fa6  T1      : 0x0000000f  T2      : 0x00000000
S0/FP   : 0x00000000  S1      : 0x00000000  A0      : 0x00000001  A1      : 0x00000001
A2      : 0x00000064  A3      : 0x00000004  A4      : 0x00000001  A5      : 0x00000000
A6      : 0x42001fd6  A7      : 0x00000000  S2      : 0x00000000  S3      : 0x00000000
0x42001fd6: uart_write at /Users/user/esp/esp-idf/components/vfs/vfs_uart.c:201

S4      : 0x00000000  S5      : 0x00000000  S6      : 0x00000000  S7      : 0x00000000
S8      : 0x00000000  S9      : 0x00000000  S10     : 0x00000000  S11     : 0x00000000
T3      : 0x00000000  T4      : 0x00000000  T5      : 0x00000000  T6      : 0x00000000
MSTATUS : 0x00001881  MTVEC   : 0x40380001  MCAUSE  : 0x00000007  MTVAL   : 0x00000000
MHARTID : 0x00000000
Moreover, IDF Monitor is also capable of generating and printing a backtrace thanks to the stack dump provided by the board in the panic handler. The output looks like this:
Backtrace:

0x42006686 in bar (ptr=ptr@entry=0x0) at ../main/hello_world_main.c:18
18      *ptr = 0x42424242;
#0  0x42006686 in bar (ptr=ptr@entry=0x0) at ../main/hello_world_main.c:18
#1  0x42006692 in foo () at ../main/hello_world_main.c:22
#2  0x420066ac in app_main () at ../main/hello_world_main.c:28
#3  0x42015ece in main_task (args=<optimized out>) at /Users/user/esp/components/freertos/port/port_common.c:142
#4  0x403859b8 in vPortEnterCritical () at /Users/user/esp/components/freertos/port/riscv/port.c:130
#5  0x00000000 in ?? ()
Backtrace stopped: frame did not save the PC
While the backtrace above is very handy, it requires the user to use IDF Monitor. Thus, in order to generate and print a backtrace while using another monitor program, it is possible to activate CONFIG_ESP_SYSTEM_USE_EH_FRAME option from the menuconfig, under the "Backtracing method" menu.
This option will let the compiler generate DWARF information for each function of the project. Then, when a CPU exception occurs, the panic handler will parse these data and determine the backtrace of the task that failed. The output looks like this:
Backtrace: 0x42009e9a:0x3fc92120 0x42009ea6:0x3fc92120 0x42009ec2:0x3fc92130 0x42024620:0x3fc92150 0x40387d7c:0x3fc92160 0xfffffffe:0x3fc92170
These PC:SP pairs represent the PC (Program Counter) and SP (Stack Pointer) for each stack frame of the current task.
The main benefit of the CONFIG_ESP_SYSTEM_USE_EH_FRAME option is that the backtrace is generated by the board itself (without the need for IDF Monitor). However, the option's drawback is that it results in an increase of the compiled binary's size (ranging from 20% to 100% increase in size). Furthermore, this option causes debug information to be included within the compiled binary. Therefore, users are strongly advised not to enable this option in mass production builds.
Another option to generate such backtrace on the device itself is to enable CONFIG_ESP_SYSTEM_USE_FRAME_POINTER option from the menuconfig, under the "Backtracing method" menu.
This option will let the compiler reserve a CPU register that keeps track of the frame of each routine of the program. This registers makes it possible for the panic handler to unwind the call stack at any given time, and more importantly, when a CPU exception occurs.
Enabling CONFIG_ESP_SYSTEM_USE_FRAME_POINTER option will result in an increase of the compiled binary's size of around +5-6% and a performance decrease of around 1%. Contrarily to the CONFIG_ESP_SYSTEM_USE_EH_FRAME option, the compiler won't generate debug information in the generated binary, so it is possible to use this feature in mass production builds.
To find the location where a fatal error has happened, look at the lines which follow the "Backtrace" line. Fatal error location is the top line, and subsequent lines show the call stack.
GDB Stub
If the CONFIG_ESP_SYSTEM_PANIC_GDBSTUB option is enabled, the panic handler will not reset the chip when a fatal error happens. Instead, it will start a GDB remote protocol server, commonly referred to as GDB Stub. When this happens, a GDB instance running on the host computer can be instructed to connect to the ESP32-C3 UART port.
If IDF Monitor is used, GDB is started automatically when a GDB Stub prompt is detected on the UART. The output looks like this:
Entering gdb stub now.
$T0b#e6GNU gdb (crosstool-NG crosstool-ng-1.22.0-80-gff1f415) 7.10
Copyright (C) 2015 Free Software Foundation, Inc.
License GPLv3+: GNU GPL version 3 or later <http://gnu.org/licenses/gpl.html>
This is free software: you are free to change and redistribute it.
There is NO WARRANTY, to the extent permitted by law.  Type "show copying"
and "show warranty" for details.
This GDB was configured as "--host=x86_64-build_apple-darwin16.3.0 --target=riscv32-esp-elf".
Type "show configuration" for configuration details.
For bug reporting instructions, please see:
<http://www.gnu.org/software/gdb/bugs/>.
Find the GDB manual and other documentation resources online at:
<http://www.gnu.org/software/gdb/documentation/>.
For help, type "help".
Type "apropos word" to search for commands related to "word"...
Reading symbols from /Users/user/esp/example/build/example.elf...done.
Remote debugging using /dev/cu.usbserial-31301
0x400e1b41 in app_main ()
    at /Users/user/esp/example/main/main.cpp:36
36      *((int*) 0) = 0;
(gdb)
The GDB prompt can be used to inspect CPU registers, local and static variables, and arbitrary locations in memory. It is not possible to set breakpoints, change the PC, or continue execution. To reset the program, exit GDB and perform an external reset: Ctrl-T Ctrl-R in IDF Monitor, or using the external reset button on the development board.
RTC Watchdog Timeout
The RTC watchdog is used in the startup code to keep track of execution time and it also helps to prevent a lock-up caused by an unstable power source. It is enabled by default (see CONFIG_BOOTLOADER_WDT_ENABLE). If the execution time is exceeded, the RTC watchdog will restart the system. In this case, the first stage (ROM) bootloader will print a message with the RTC Watchdog Timeout reason for the reboot.
rst:0x10 (RTCWDT_RTC_RST)
The RTC watchdog covers the execution time from the first stage (ROM) bootloader to application startup. It is initially set in the first stage (ROM) bootloader, then configured in the bootloader with the CONFIG_BOOTLOADER_WDT_TIME_MS option (9000 ms by default). During the application initialization stage, it is reconfigured because the source of the slow clock may have changed, and finally disabled right before the app_main() call. There is an option CONFIG_BOOTLOADER_WDT_DISABLE_IN_USER_CODE which prevents the RTC watchdog from being disabled before app_main. Instead, the RTC watchdog remains active and must be fed periodically in your application's code.
The RTC watchdog is also used by the system panic handler to protect the system from hanging during a panic. The RTC watchdog is reconfigured in the panic handler to have a timeout of 10 seconds. If the panic handler takes longer than 10 seconds to execute, the system will be reset by the RTC watchdog.
Guru Meditation Errors
This section explains the meaning of different error causes, printed in parens after the Guru Meditation Error: Core panic'ed message.
Note
See the Guru Meditation Wikipedia article for historical origins of "Guru Meditation".
Illegal instruction
This CPU exception indicates that the instruction which was executed was not a valid instruction. The most common reasons for this error include:
FreeRTOS task function has returned. In FreeRTOS, if a task function needs to terminate, it should call
vTaskDelete()and delete itself, instead of returning.Failure to read next instruction from SPI flash. This usually happens if:
Application has reconfigured the SPI flash pins as some other function (GPIO, UART, etc.). Consult the Hardware Design Guidelines and the datasheet for the chip or module for details about the SPI flash pins.
Some external device has accidentally been connected to the SPI flash pins, and has interfered with communication between ESP32-C3 and SPI flash.
In C++ code, exiting from a non-void function without returning a value is considered to be an undefined behavior. When optimizations are enabled, the compiler will often omit the epilogue in such functions. This most often results in an Illegal instruction exception. By default, ESP-IDF build system enables
-Werror=return-typewhich means that missing return statements are treated as compile time errors. However if the application project disables compiler warnings, this issue might go undetected and the Illegal instruction exception will occur at run time.
Instruction Address Misaligned
This CPU exception indicates that the address of the instruction to execute is not 2-byte aligned.
Instruction Access Fault, Load Access Fault, Store Access Fault
This CPU exception happens when application attempts to execute, read from or write to an invalid memory location. The address which was written/read is found in MTVAL register in the register dump. If this address is zero, it usually means that application attempted to dereference a NULL pointer. If this address is close to zero, it usually means that application attempted to access member of a structure, but the pointer to the structure was NULL. If this address is something else (garbage value, not in 0x3fxxxxxx - 0x6xxxxxxx range), it likely means that the pointer used to access the data was either not initialized or was corrupted.
Breakpoint
This CPU exception happens when the instruction EBREAK is executed. See also FreeRTOS End of Stack Watchpoint.
Load Address Misaligned, Store Address Misaligned
Application has attempted to read or write memory location, and address alignment did not match load/store size. For example, 32-bit load can only be done from 4-byte aligned address, and 16-bit load can only be done from a 2-byte aligned address.
Interrupt Watchdog Timeout on CPU0/CPU1
Indicates that an interrupt watchdog timeout has occurred. See Watchdogs for more information.
Cache error
In some situations, ESP-IDF will temporarily disable access to external SPI flash and SPI RAM via caches. For example, this happens when spi_flash APIs are used to read/write/erase/mmap regions of SPI flash. In these situations, tasks are suspended, and interrupt handlers not registered with ESP_INTR_FLAG_IRAM are disabled. Make sure that any interrupt handlers registered with this flag have all the code and data in IRAM/DRAM. For more details, see the SPI flash API documentation and the IRAM-Safe Interrupt Handlers section.
Memory Protection Fault
ESP32-C3 Permission Control feature is used in ESP-IDF to prevent the following types of memory access:
writing to instruction RAM after the program is loaded
executing code from data RAM (areas used for heap and static .data and .bss)
Such operations are not necessary for most programs. Prohibiting such operations typically makes software vulnerabilities harder to exploit. Applications which rely on dynamic loading or self-modifying code may disable this protection using CONFIG_ESP_SYSTEM_MEMPROT Kconfig option.
When the fault occurs, the panic handler reports the address of the fault and the type of memory access that caused it.
Other Fatal Errors
Brownout
ESP32-C3 has a built-in brownout detector, which is enabled by default. The brownout detector can trigger a system reset if the supply voltage goes below a safe level. The brownout detector can be configured using CONFIG_ESP_BROWNOUT_DET and CONFIG_ESP_BROWNOUT_DET_LVL_SEL options.
When the brownout detector triggers, the following message is printed:
Brownout detector was triggered
The chip is reset after the message is printed.
Note that if the supply voltage is dropping at a fast rate, only part of the message may be seen on the console.
Corrupt Heap
ESP-IDF's heap implementation contains a number of run-time checks of the heap structure. Additional checks ("Heap Poisoning") can be enabled in menuconfig. If one of the checks fails, a message similar to the following will be printed:
CORRUPT HEAP: Bad tail at 0x3ffe270a. Expected 0xbaad5678 got 0xbaac5678
assertion "head != NULL" failed: file "/Users/user/esp/esp-idf/components/heap/multi_heap_poisoning.c", line 201, function: multi_heap_free
abort() was called at PC 0x400dca43 on core 0
Consult Heap Memory Debugging documentation for further information.
Stack overflow
Hardware Stack Guard
ESP32-C3 has an integrated assist-debug module that can watch the SP register to ensure that it is within the bounds of allocated stack memory. The assist-debug module needs to set new stack bounds on every interrupt handling and FreeRTOS context switch. This can have a small impact on performance.
Here are some additional details about the assist-debug module:
Implemented in hardware
Watches Stack Pointer register value
Requires no additional CPU time or memory while watching stack bounds
When the assist-debug module detects a stack overflow, the panic handler will run and display a message that resembles the following:
Guru Meditation Error: Core 0 panic'ed (Stack protection fault).
Hardware stack guard can be disabled using CONFIG_ESP_SYSTEM_HW_STACK_GUARD options.
FreeRTOS End of Stack Watchpoint
ESP-IDF provides a custom FreeRTOS stack overflow detecting mechanism based on watchpoints. Every time FreeRTOS switches task context, one of the watchpoints is set to watch the last 32 bytes of stack.
Generally, this may cause the watchpoint to be triggered up to 28 bytes earlier than expected. The value 32 is chosen because it is larger than the stack canary size in FreeRTOS (20 bytes). Adopting this approach ensures that the watchpoint triggers before the stack canary is corrupted, not after.
Note
Not every stack overflow is guaranteed to trigger the watchpoint. It is possible that the task writes to memory beyond the stack canary location, in which case the watchpoint will not be triggered.
If watchpoint triggers, the message will be similar to:
Guru Meditation Error: Core 0 panic'ed (Breakpoint). Exception was unhandled.
This feature can be enabled by using the CONFIG_FREERTOS_WATCHPOINT_END_OF_STACK option.
FreeRTOS Stack Checks
Stack Smashing
Stack smashing protection (based on GCC -fstack-protector* flags) can be enabled in ESP-IDF using CONFIG_COMPILER_STACK_CHECK_MODE option. If stack smashing is detected, message similar to the following will be printed:
Stack smashing protect failure!

abort() was called at PC 0x400d2138 on core 0

Backtrace: 0x4008e6c0:0x3ffc1780 0x4008e8b7:0x3ffc17a0 0x400d2138:0x3ffc17c0 0x400e79d5:0x3ffc17e0 0x400e79a7:0x3ffc1840 0x400e79df:0x3ffc18a0 0x400e2235:0x3ffc18c0 0x400e1916:0x3ffc18f0 0x400e19cd:0x3ffc1910 0x400e1a11:0x3ffc1930 0x400e1bb2:0x3ffc1950 0x400d2c44:0x3ffc1a80
0
The backtrace should point to the function where stack smashing has occurred. Check the function code for unbounded access to local arrays.
Undefined Behavior Sanitizer (UBSAN) Checks
Undefined behavior sanitizer (UBSAN) is a compiler feature which adds run-time checks for potentially incorrect operations, such as:
overflows (multiplication overflow, signed integer overflow)
shift base or exponent errors (e.g., shift by more than 32 bits)
integer conversion errors
See GCC documentation of -fsanitize=undefined option for the complete list of supported checks.
Enabling UBSAN
UBSAN is disabled by default. It can be enabled at file, component, or project level by adding the -fsanitize=undefined compiler option in the build system.
When enabling UBSAN for code which uses the SOC hardware register header files (soc/xxx_reg.h), it is recommended to disable shift-base sanitizer using -fno-sanitize=shift-base option. This is due to the fact that ESP-IDF register header files currently contain patterns which cause false positives for this specific sanitizer option.
To enable UBSAN at project level, add the following code at the end of the project's CMakeLists.txt file:
idf_build_set_property(COMPILE_OPTIONS "-fsanitize=undefined" "-fno-sanitize=shift-base" APPEND)
Alternatively, pass these options through the EXTRA_CFLAGS and EXTRA_CXXFLAGS environment variables.
Enabling UBSAN results in significant increase of code and data size. Most applications, except for the trivial ones, will not fit into the available RAM of the microcontroller when UBSAN is enabled for the whole application. Therefore it is recommended that UBSAN is instead enabled for specific components under test.
To enable UBSAN for a specific component (component_name) from the project's CMakeLists.txt file, add the following code at the end of the file:
idf_component_get_property(lib component_name COMPONENT_LIB)
target_compile_options(${lib} PRIVATE "-fsanitize=undefined" "-fno-sanitize=shift-base")
Note
See the build system documentation for more information about build properties and component properties.
To enable UBSAN for a specific component (component_name) from CMakeLists.txt of the same component, add the following at the end of the file:
target_compile_options(${COMPONENT_LIB} PRIVATE "-fsanitize=undefined" "-fno-sanitize=shift-base")
UBSAN Output
When UBSAN detects an error, a message and the backtrace are printed, for example:
Undefined behavior of type out_of_bounds

Backtrace:0x4008b383:0x3ffcd8b0 0x4008c791:0x3ffcd8d0 0x4008c587:0x3ffcd8f0 0x4008c6be:0x3ffcd950 0x400db74f:0x3ffcd970 0x400db99c:0x3ffcd9a0
When using IDF Monitor, the backtrace will be decoded to function names and source code locations, pointing to the location where the issue has happened (here it is main.c:128):
0x4008b383: panic_abort at /path/to/esp-idf/components/esp_system/panic.c:367

0x4008c791: esp_system_abort at /path/to/esp-idf/components/esp_system/system_api.c:106

0x4008c587: __ubsan_default_handler at /path/to/esp-idf/components/esp_system/ubsan.c:152

0x4008c6be: __ubsan_handle_out_of_bounds at /path/to/esp-idf/components/esp_system/ubsan.c:223

0x400db74f: test_ub at main.c:128

0x400db99c: app_main at main.c:56 (discriminator 1)
The types of errors reported by UBSAN can be as follows:
Name |
Meaning |
|---|---|
|
Incorrect pointer value: null, unaligned, not compatible with the given type. |
|
Integer overflow during addition, subtraction, multiplication, negation. |
|
Integer division by 0 or |
|
Overflow in left or right shift operators. |
|
Access outside of bounds of an array. |
|
Unreachable code executed. |
|
Non-void function has reached its end without returning a value (C++ only). |
|
Size of variable length array is not positive. |
|
Value of |
|
Null argument passed to a function which is declared with a |
|
Null value returned from a function which is declared with |
|
|
|
Overflow in pointer arithmetic. |