Locating Problems Using Guru Meditation Error Printing
Note
This document is automatically translated using AI. Please excuse any detailed errors. The official English version is still in progress.
You can first refer to the Guru Meditation Errors in the ESP-IDF Programming Guide to understand common errors and their causes. This document provides further explanations of common errors and presents feasible analytical approaches.
Note
This analysis focuses on errors occurring in the RISC-V architecture, specifically the ESP32-C3. While errors in the Xtensa architecture (e.g., ESP32) may differ in naming, their underlying causes remain similar. Architecture-specific errors will be analyzed separately.
Guru Meditation errors are categorized into two types: ARCH exceptions and SOC exceptions.
Common ARCH exceptions:
Load access fault
Store Access Fault
Instruction Access Fault
IllegalInstruction
Common SOC exceptions:
Interrupt wdt timeout on CPU0/CPU1
Cache disable but cached memory region accessed
Often, identifying the root cause of Guru Meditation errors can be challenging, as these crashes often represent symptoms of underlying issues. The actual problems may be related to FreeRTOS, memory, flash, interrupt, etc., requiring specific analysis.
Load access fault(LoadProhibited)
Test Case
This exception occurs when a load instruction (such as lw) attempts to access invalid memory. The example code demonstrates a scenario that triggers this crash:
uint8_t *buff = NULL;
load_fault = buff[1];
Exception Phenomenon
RISC-V
Guru Meditation Error: Core  0 panic'ed (Load access fault). Exception was unhandled.

Core  0 register dump:
Stack dump detected
MEPC    : 0x4200696a  RA      : 0x4200696a  SP      : 0x3fc8f7c0  GP      : 0x3fc8b400
TP      : 0x3fc87d74  T0      : 0x4005890e  T1      : 0x3fc8f41c  T2      : 0x00000000
S0/FP   : 0x3c023000  S1      : 0x00000000  A0      : 0x0000000f  A1      : 0x3fc8f3f8
A2      : 0x00000000  A3      : 0x00000001  A4      : 0x3fc8c000  A5      : 0x00000000
A6      : 0x60023000  A7      : 0x0000000a  S2      : 0x00000000  S3      : 0x00000000
S4      : 0x00000000  S5      : 0x00000000  S6      : 0x00000000  S7      : 0x00000000
S8      : 0x00000000  S9      : 0x00000000  S10     : 0x00000000  S11     : 0x00000000
T3      : 0x00000000  T4      : 0x00000000  T5      : 0x00000000  T6      : 0x00000000
MSTATUS : 0x00001881  MTVEC   : 0x40380001  MCAUSE  : 0x00000005  MTVAL   : 0x00000001
XTENSA
Guru Meditation Error: Core  0 panic'ed (LoadProhibited). Exception was unhandled.

Core  0 register dump:
PC      : 0x42007c2f  PS      : 0x00060a30  A0      : 0x82007c42  A1      : 0x3fc97d70
A2      : 0x42011934  A3      : 0x3c023f48  A4      : 0x3c023fc8  A5      : 0x3fc97d90
A6      : 0x3fc97d70  A7      : 0x0000000c  A8      : 0x00000000  A9      : 0x3fc97d20
A10     : 0x0000000f  A11     : 0x3fc97fac  A12     : 0x3fc97d70  A13     : 0x0000000c
A14     : 0x3fc941e4  A15     : 0x00000000  SAR     : 0x00000004  EXCCAUSE: 0x0000001c

Backtrace: 0x42007c2c:0x3fc97d70 0x42007c3f:0x3fc97d90 0x42019247:0x3fc97db0 0x40379e71:0x3fc97de0
Troubleshooting
If further analyze the assembly code (the steps can be referred to Appendix 1 - ESP Disassembly Corresponding Instructions), you can find it corresponds to the following instructions:
lw a1, 1(zero)               // RSIC-V
l8ui    a11, a8, 1           // XTENSA
When this type of exception is triggered, MTVAL/EXCVADDR will automatically update to data related to the exception. From the RISC-V exception error, you can see MTVAL : 0x00000001.
Usually, MTVAL being NULL(0x00000000) represents taking a value from a NULL address, and close to NULL represents trying to access a member of an array or structure from a NULL address.
For the RSIC-V architecture, the PC and RA registers contain the function pointer of the exception, and you can find the corresponding function from the elf.
For the Xtensa architecture, a backtrace will be printed during an exception, and the corresponding function can also be found from the elf.
Practical Case
The following figure is a typical ESP32-C3 Load access fault issue.
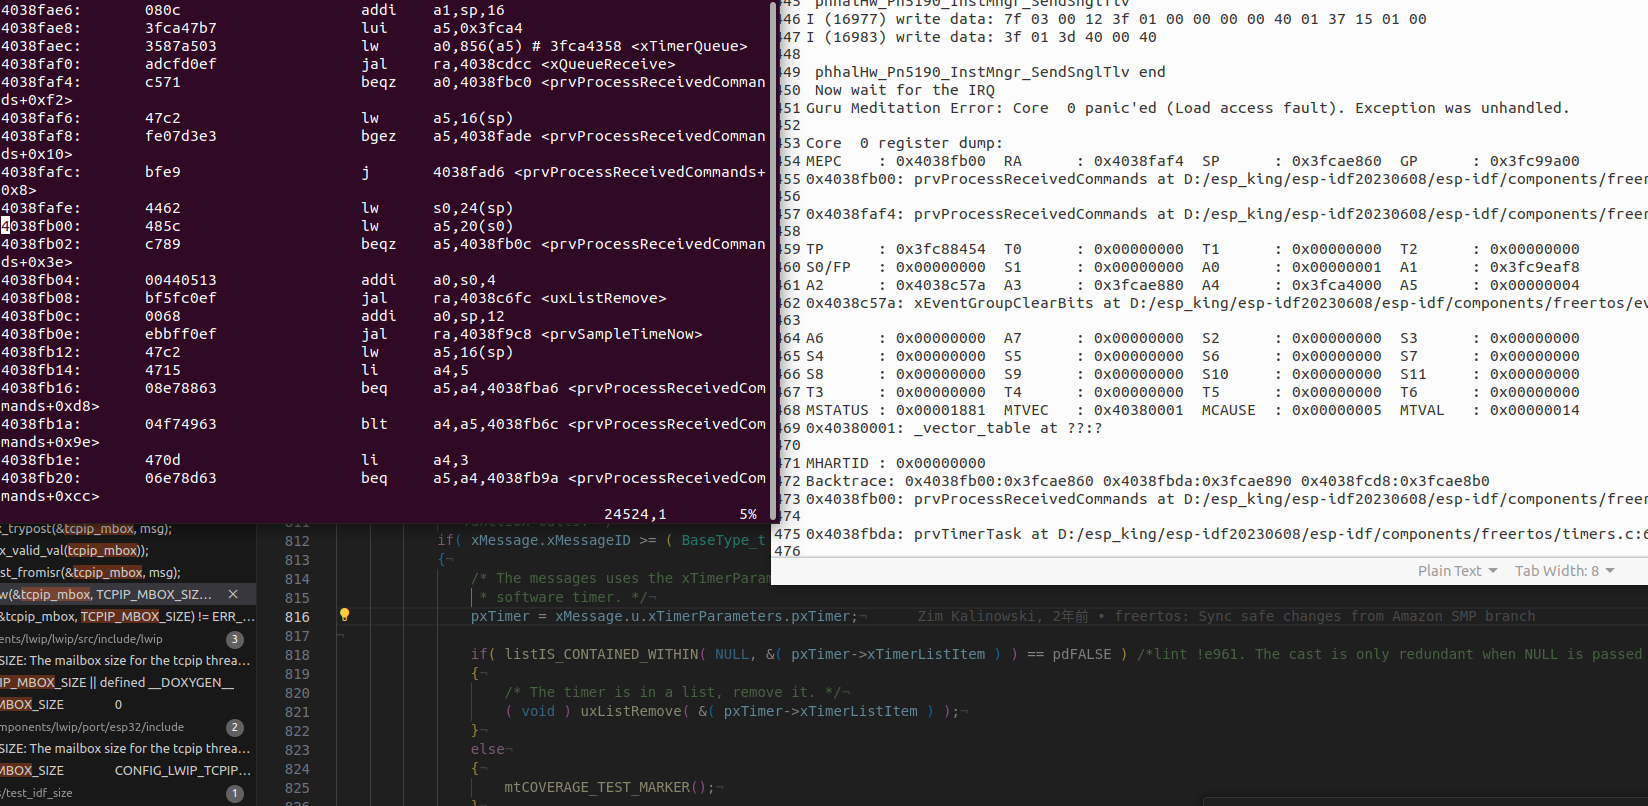
From the above figure, the problem lies in lw a5, 20(s0), s0 is 0x0, which corresponds to a NULL pointer. And then analyze the previous assembly lw s0, 24(sp), the corresponding code segment is pxTimer = xMessage.u.xTimerParameters.pxTimer;, at this point the question can be changed to why pxTimer is NULL.
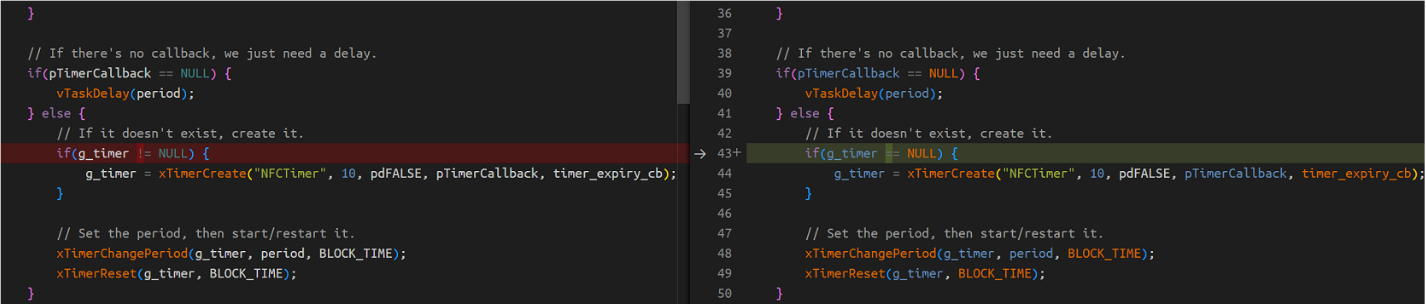
You can further locate the problem by adding the following debug log:
if (pxTimer == NULL) {
    ets_printf("xMessageID: %d\n", xMessage.xMessageID);
}
The problem was finally found to be that the timer was not successfully created. The pointer pointing to the timer is NULL. If subsequent timer operations are performed at this time, a Load access fault(LoadProhibited) error will occur due to the null pointer.
Precautions
Not all Load access fault(LoadProhibited) problems can be simply located. As shown in the figure below:
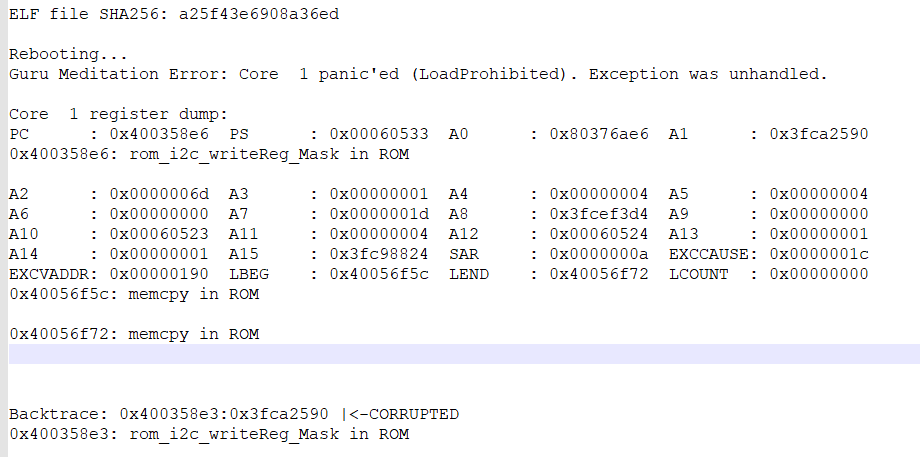
The PC address points to the ROM function rom_i2c_writeReg_mask function, and the Backtrace does not have enough valid information. In this case, a satble reproduction is required for troubleshooting. If the problem is difficult to be reproduced, it may be caused by hardware or wild pointer.
Store access fault(StoreProhibited)
Test Case
When an application tries to write to an invalid memory location, this type of CPU exception occurs. The test code is shown below:
typedef struct {
    uint8_t buf[10];
    uint8_t data;
} store_test_t;

void store_access_fault(store_test_t * store_test)
{
    store_test->data = 0x5F;
    printf("Data: %d\n", store_test->data);
}
void app_main(void)
{
    store_test_t * store_test = NULL;
    store_access_fault(store_test);
}
Exception Phenomenon
RISC-V
In the RISC-V architecture chip, you can see the following exception printout. Analyze the assembly instructions (the steps can be referred to Appendix 1 - ESP Disassembly Corresponding Instructions), when this exception occurs, the PC address points to sb/sw and other store-related instructions. At this time, the exception value 0x0000000a stored in MTVAL indicates that it wants to access the content in an array or structure starting from NULL address.
Guru Meditation Error: Core  0 panic'ed (Store access fault). Exception was unhandled.

Core  0 register dump:
Stack dump detected
MEPC    : 0x42006960  RA      : 0x42006984  SP      : 0x3fc8f7c0  GP      : 0x3fc8b400
TP      : 0x3fc87d7c  T0      : 0x4005890e  T1      : 0x20000000  T2      : 0x00000000
S0/FP   : 0x3c023000  S1      : 0x00000000  A0      : 0x00000000  A1      : 0x3fc8f3f8
A2      : 0x00000000  A3      : 0x00000001  A4      : 0x3fc8c000  A5      : 0x0000005f
A6      : 0x60023000  A7      : 0x0000000a  S2      : 0x00000000  S3      : 0x00000000
S4      : 0x00000000  S5      : 0x00000000  S6      : 0x00000000  S7      : 0x00000000
S8      : 0x00000000  S9      : 0x00000000  S10     : 0x00000000  S11     : 0x00000000
T3      : 0x00000000  T4      : 0x00000000  T5      : 0x00000000  T6      : 0x00000000
MSTATUS : 0x00001881  MTVEC   : 0x40380001  MCAUSE  : 0x00000007  MTVAL   : 0x0000000a
XTENSA
In the XTENSA architecture chip, you can see the following exception printout. Analyze the assembly instructions (steps can be referred to Appendix 1 - ESP Disassembly Corresponding Instructions), when this exception occurs, the PC address points to s8i/s32i and other store-related instructions. At this time, the exception value 0x0000000a stored in EXCVADDR indicates that it wants to access the content in an array or structure starting from NULL address.
Guru Meditation Error: Core  0 panic'ed (StoreProhibited). Exception was unhandled.

Core  0 register dump:
PC      : 0x42007c21  PS      : 0x00060630  A0      : 0x82007c38  A1      : 0x3fc97d70
A2      : 0x00000000  A3      : 0x3c023f48  A4      : 0x3c023fc8  A5      : 0x3fc97d90
A6      : 0x3fc97d70  A7      : 0x0000000c  A8      : 0x0000005f  A9      : 0x3fc97d00
A10     : 0x00000031  A11     : 0x3fc97fac  A12     : 0x3fc97d70  A13     : 0x0000000c
A14     : 0x3fc941e4  A15     : 0x00000000  SAR     : 0x00000004  EXCCAUSE: 0x0000001d
EXCVADDR: 0x0000000a  LBEG    : 0x400556d5  LEND    : 0x400556e5  LCOUNT  : 0xfffffffd

Backtrace: 0x42007c1e:0x3fc97d70 0x42007c35:0x3fc97d90 0x4201923f:0x3fc97db0 0x40379e71:0x3fc97de0
Location Method
The location method is similar to Load access fault(LoadProhibited). Analyze the assembly code (steps can be referred to Appendix 1 - ESP Disassembly Corresponding Instructions), you will see the following instruction:
sb      a5,10(a0)             // RSIC-V
s8i     a8, a2, 10            // XTENSA
When this type of exception being triggered, MTVAL/EXCVADDR will automatically update to data related to the exception, as can be seen from the RISC-V exception information MTVAL : 0x0000000a. Usually, MTVAL being NULL means that the CPU is trying to write data to a NULL address, and close to NULL means trying to write data to a member of an array or structure starting from a NULL address.
For the RSIC-V architecture, the PC and RA registers contain the function pointers of the exception, and the corresponding function can be found from the elf
For the Xtensa architecture, a backtrace will be printed during an exception, and the corresponding function can also be found from the elf
Actual Case
Please refer to Test Case.
Notes
Similar to the Load access fault(LoadProhibited) issue, there are wild pointers cases that cannot be analyzed, and further analysis is required based on the actual application code.
Instruction Access Fault(InstrFetchProhibited)
Test Case
When an application tries to read instructions from an invalid address, this type of CPU exception occurs, and the PC register often points to an invalid memory address. The test code is as follows:
typedef void (*fptr_t)(void);
volatile fptr_t fptr = (fptr_t) 0x4;
fptr();
The corresponding RISC-V assembly instruction (steps can refer to Appendix 1 - ESP Disassembly Corresponding Instructions) is as follows:
42006958:       1101                    addi    sp,sp,-32
4200695a:       ce06                    sw      ra,28(sp)
4200695c:       4791                    li      a5,4
4200695e:       c63e                    sw      a5,12(sp)
42006960:       47b2                    lw      a5,12(sp)
42006962:       9782                    jalr    a5
42006964:       40f2                    lw      ra,28(sp)
42006966:       6105                    addi    sp,sp,32
42006968:       8082                    ret
Exception Phenomenon
RISC-V
Guru Meditation Error: Core  0 panic'ed (Instruction access fault). Exception was unhandled.

Core  0 register dump:
Stack dump detected
MEPC    : 0x00000004  RA      : 0x42006964  SP      : 0x3fc8f7b0  GP      : 0x3fc8b400
TP      : 0x3fc87d8c  T0      : 0x4005890e  T1      : 0x20000000  T2      : 0x00000000
S0/FP   : 0x3c023000  S1      : 0x00000000  A0      : 0x00000031  A1      : 0x3fc8f3f8
A2      : 0x00000000  A3      : 0x00000001  A4      : 0x3fc8c000  A5      : 0x00000004
A6      : 0x60023000  A7      : 0x0000000a  S2      : 0x00000000  S3      : 0x00000000
S4      : 0x00000000  S5      : 0x00000000  S6      : 0x00000000  S7      : 0x00000000
S8      : 0x00000000  S9      : 0x00000000  S10     : 0x00000000  S11     : 0x00000000
T3      : 0x00000000  T4      : 0x00000000  T5      : 0x00000000  T6      : 0x00000000
MSTATUS : 0x00001881  MTVEC   : 0x40380001  MCAUSE  : 0x00000001  MTVAL   : 0x00000004
Xtensa
Guru Meditation Error: Core  0 panic'ed (InstrFetchProhibited). Exception was unhandled.

Core  0 register dump:
PC      : 0x00000004  PS      : 0x00060630  A0      : 0x800d539a  A1      : 0x3ffb4a30
A2      : 0x400de738  A3      : 0x3f40379c  A4      : 0x3f40381c  A5      : 0x3ffb4a60
A6      : 0x3ffb4a40  A7      : 0x0000000c  A8      : 0x800e4dbe  A9      : 0x3ffb49d0
A10     : 0x00000031  A11     : 0x3ffafc64  A12     : 0x3ffb4a40  A13     : 0x0000000c
A14     : 0x3ffb2770  A15     : 0x0000cdcd  SAR     : 0x00000004  EXCCAUSE: 0x00000014
EXCVADDR: 0x00000004  LBEG    : 0x400014fd  LEND    : 0x4000150d  LCOUNT  : 0xfffffffd

Backtrace: 0x00000001:0x3ffb4a30 0x400d5397:0x3ffb4a60 0x400e54f8:0x3ffb4a80 0x400858e9:0x3ffb4ab0
Troubleshooting Method
Usually, such problems are caused by wild pointers. In this case, the PC register has no value, and whether other registers are worth analyzing depends on the running time of the wild pointer. For this test code, the current function has triggered a CPU exception, so the RA register contains the pointer of the upper-layer function (Xtensa architecture using Backtrace), and the exception can be analyzed at this case. But most of the time, the RA register will be destroyed. You can follow the steps below to locate the problem:
Stably reproduce the problem, ensure that the problem is the same at each time
Find the pattern of the problem, such as what operations are performed, or which logs are printed before the exception starts
Analyze in conjunction with the code based on the location of the program exception, add debugging logs and gradually reducing the amount of project code, and see if the problem can still be reproduced.
Actual Case
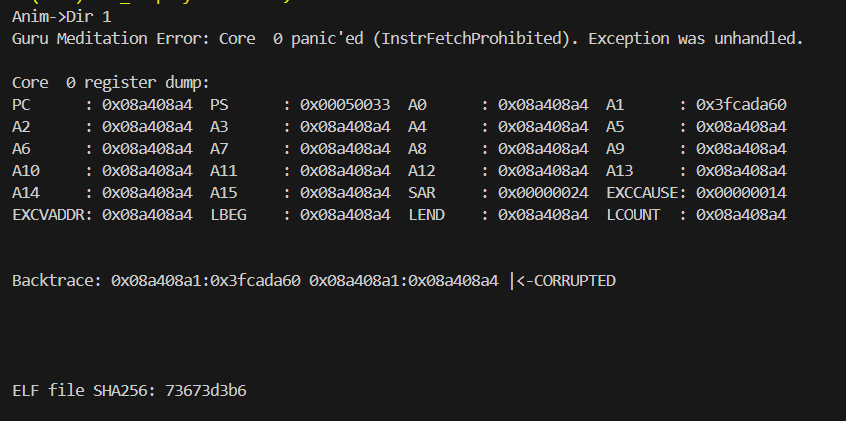
As shown in the figure below, the scene of the exception has been completely destroyed. There is no way to infer the cause of the problem based on the information. However, most registers are destroyed into a fixed value, which is also a pattern. In cases where all registers are destroyed, it is usually a problem caused by memory trampling, which can be analyzed using the heap memory debugging method.
Illegal Instruction
Test Case
During the CPU instruction fetching phase, an illegal instruction (defined in the RISC-V spec as a 16-bit instruction all set to 0) will print this error. The test code is as follows:
uint32_t instr_dram_addr = 0x0;
intptr_t instr_addr = MAP_DRAM_TO_IRAM((intptr_t)&instr_dram_addr);
typedef void (*illegal_instr_t)(void);
illegal_instr_t illegal_instr = (uint32_t *)instr_addr; // Ensure that the memory data in instr_addr is 0x0
illegal_instr();
Note
The ESP32 in the Xtensa platform does not support the above test case. If other chips want to run this test case, they need to turn off the memory protection function first.
Exception Phenomenon
RISC-V
Guru Meditation Error: Core  0 panic'ed (Illegal instruction). Exception was unhandled.

Core  0 register dump:
Stack dump detected
MEPC    : 0x4005f002  RA      : 0x42006962  SP      : 0x3fc8f7c0  GP      : 0x3fc8b400
0x42006962: illegal_instr_fault at /home/jacques/useful_example/crash_sim/store_access_fault/main/hello_world_main.c:79

TP      : 0x3fc87d8c  T0      : 0x4005890e  T1      : 0x20000000  T2      : 0x00000000
S0/FP   : 0x3c023000  S1      : 0x00000000  A0      : 0x3fc8f840  A1      : 0x3fc8f3f8
A2      : 0x00000000  A3      : 0x00000001  A4      : 0x3fc8c000  A5      : 0x4005f000
A6      : 0x60023000  A7      : 0x0000000a  S2      : 0x00000000  S3      : 0x00000000
S4      : 0x00000000  S5      : 0x00000000  S6      : 0x00000000  S7      : 0x00000000
S8      : 0x00000000  S9      : 0x00000000  S10     : 0x00000000  S11     : 0x00000000
T3      : 0x00000000  T4      : 0x00000000  T5      : 0x00000000  T6      : 0x00000000
MSTATUS : 0x00001881  MTVEC   : 0x40380001  MCAUSE  : 0x00000002  MTVAL   : 0x00000000
Xtensa
Guru Meditation Error: Core  0 panic'ed (IllegalInstruction). Exception was unhandled.
Memory dump at 0x403e298c: 00000000 00000000 00000000
Core  0 register dump:
PC      : 0x403e2990  PS      : 0x00060130  A0      : 0x820059fe  A1      : 0x3fcf2990
A2      : 0x4200c030  A3      : 0x3c0232fc  A4      : 0x3c02337c  A5      : 0x3fcf29c0
A6      : 0x3fcf29a0  A7      : 0x0000000c  A8      : 0x820059f4  A9      : 0x3fcf2930
A10     : 0x00000031  A11     : 0x3fcf2be4  A12     : 0x3fcf29a0  A13     : 0x0000000c
A14     : 0x3fc922c4  A15     : 0x00000000  SAR     : 0x00000004  EXCCAUSE: 0x00000000
EXCVADDR: 0x00000000  LBEG    : 0x400556d5  LEND    : 0x400556e5  LCOUNT  : 0xfffffffd

Backtrace: 0x403e298d:0x3fcf2990 |<-CORRUPTED
Troubleshooting
Although the ESP-IDF documentation contains Explanation of Illegal instruction, which mentions that there may be 3 types of situations that trigger this issue, in actual use, most of them are caused by the CPU fetching instructions from flash abnormally. Another part of them are caused by wild pointers fetching abnormal memory. From the PC address, it can be seen whether the addressing is abnormal from IRAM or flash.
Senarios for problems with fetching instructions from flash include: flash powering down when chip is sleeping, unstable CS pull-up, unstable flash power supply, and flash suspend function, etc.
Actual Case
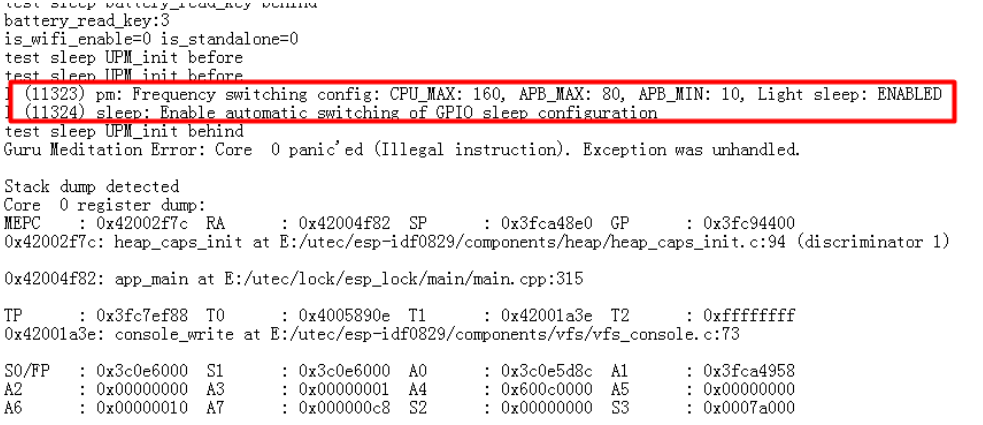
The following diagram shows an abnormal senario of the ESP chip in a low-power scenario. From the log, there is a power save printout before the error, which suggests that the problem may be related to the chip’s sleep mode. Later, by disabling the CONFIG turn off the flash power during sleep (CONFIG_ESP_SLEEP_POWER_DOWN_FLASH) and enabling the CONFIG CS software pull-up during sleep (CONFIG_ESP_SLEEP_FLASH_LEAKAGE_WORKAROUND), the problem no longer occurs.
Cache disable but cached memory region accessed (Cache error)
Abnormal Reason
During flash operations (read/write/erase), the cache is turned off for a short time. If an interrupt is triggered during this time (interrupts decorated with ESP_INTR_FLAG_IRAM can be triggered when the cache is off), such as if there are functions in the interrupt function that need to fetch instructions or data from the flash through the cache (includingmmap), an exception will occur because the cache is turned off.
Test Case
After turning off the cache, access and print the data in the flash. The test code is shown below:
static const uint32_t s_in_rodata[8] = { 0x12345678, 0xfedcba98 };
spi_flash_disable_interrupts_caches_and_other_cpu();
volatile uint32_t* src = (volatile uint32_t*) s_in_rodata;
uint32_t v1 = src[0];
uint32_t v2 = src[1];
ets_printf("%lx %lx\n", v1, v2);
Abnormal Phenomenon
RISC-V
Guru Meditation Error: Core  0 panic'ed (Cache error).
access to cache while dbus or cache is disabled

Stack dump detected
Core  0 register dump:
MEPC    : 0x40000040  RA      : 0x40381e82  SP      : 0x3fc8f7c0  GP      : 0x3fc8b400
0x40381e82: cache_access_test_func at /home/jacques/useful_example/crash_sim/store_access_fault/main/hello_world_main.c:38

TP      : 0x3fc87d5c  T0      : 0x4005890e  T1      : 0x20000000  T2      : 0x00000000
S0/FP   : 0x3c023000  S1      : 0x00000000  A0      : 0x3c025610  A1      : 0x00000000
A2      : 0x00000000  A3      : 0x00000200  A4      : 0x600c4000  A5      : 0x3c02561c
A6      : 0x60023000  A7      : 0x0000000a  S2      : 0x00000000  S3      : 0x00000000
S4      : 0x00000000  S5      : 0x00000000  S6      : 0x00000000  S7      : 0x00000000
S8      : 0x00000000  S9      : 0x00000000  S10     : 0x00000000  S11     : 0x00000000
T3      : 0x00000000  T4      : 0x00000000  T5      : 0x00000000  T6      : 0x00000000
MSTATUS : 0x00001881  MTVEC   : 0x40380001  MCAUSE  : 0x00000019  MTVAL   : 0x6944806f
Xtensa
Guru Meditation Error: Core  0 panic'ed (Cache disabled but cached memory region accessed).

Core  0 register dump:
PC      : 0x400830ed  PS      : 0x00060a34  A0      : 0x800d539a  A1      : 0x3ffb4a40
0x400830ed: cache_access_test_func at /home/jacques/useful_example/crash_sim/store_access_fault/main/hello_world_main.c:32

A2      : 0x400de738  A3      : 0x3f40379c  A4      : 0x3f40381c  A5      : 0x3ffb4a60
0x400de738: vprintf at /builds/idf/crosstool-NG/.build/xtensa-esp32-elf/src/newlib/newlib/libc/stdio/vprintf.c:30

A6      : 0x3ffb4a40  A7      : 0x0000000c  A8      : 0x3f4040c4  A9      : 0x3ffb4a10
A10     : 0x00000001  A11     : 0xbad00bad  A12     : 0x3ffb2608  A13     : 0x0000000c
A14     : 0x3ffb2770  A15     : 0x0000cdcd  SAR     : 0x00000004  EXCCAUSE: 0x00000007
EXCVADDR: 0x00000000  LBEG    : 0x400014fd  LEND    : 0x4000150d  LCOUNT  : 0xfffffffd

Backtrace: 0x400830ea:0x3ffb4a40 0x400d5397:0x3ffb4a60 0x400e54e4:0x3ffb4a80 0x40085915:0x3ffb4ab0
Analysis Method
In such cases, focus on the PC address of the exception. If the address is in flash, it means that instructions are read from flash when the cache is closed. You need to decorate the corresponding function with IRAM_ATTR. It should be noted that IRAM_ATTR is only for the current function. If this function has sub-functions, all the sub-functions need to be decorated with IRAM_ATTR.
If the address is in IRAM, it means that there is no problem with this function itself, but the input parameters of this function may need to be read from flash.
Practical Case
During flash read and write operations (causing cache close), the gptimer interrupt that has been put into IRAM is also triggered. The gptimer ISR executes some operations that need to read content from flash, triggering this problem:
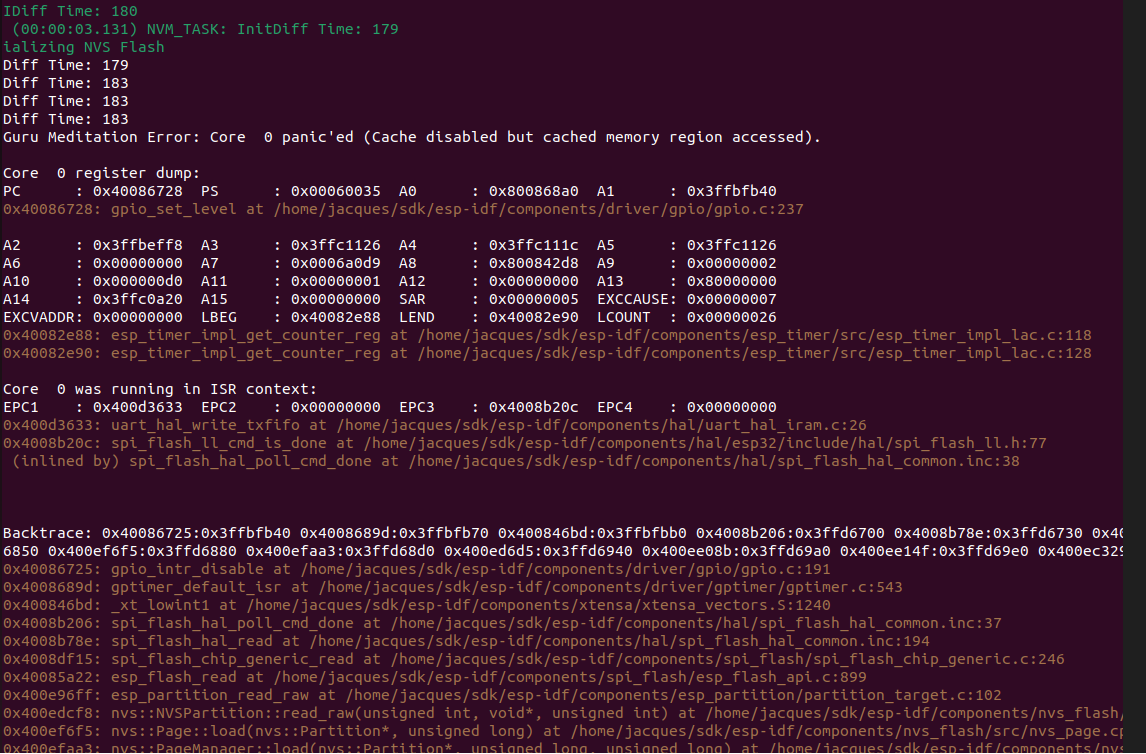
From the figure above, we can conclude several problem points
It can be confirmed that the gptimer interrupt is triggered during flash read and write operations, and there is content in the flash in the ISR
The function
gpio_set_levelpointed by the PC has been put into IRAM instead of flash, so it should run normally when the cache is closed
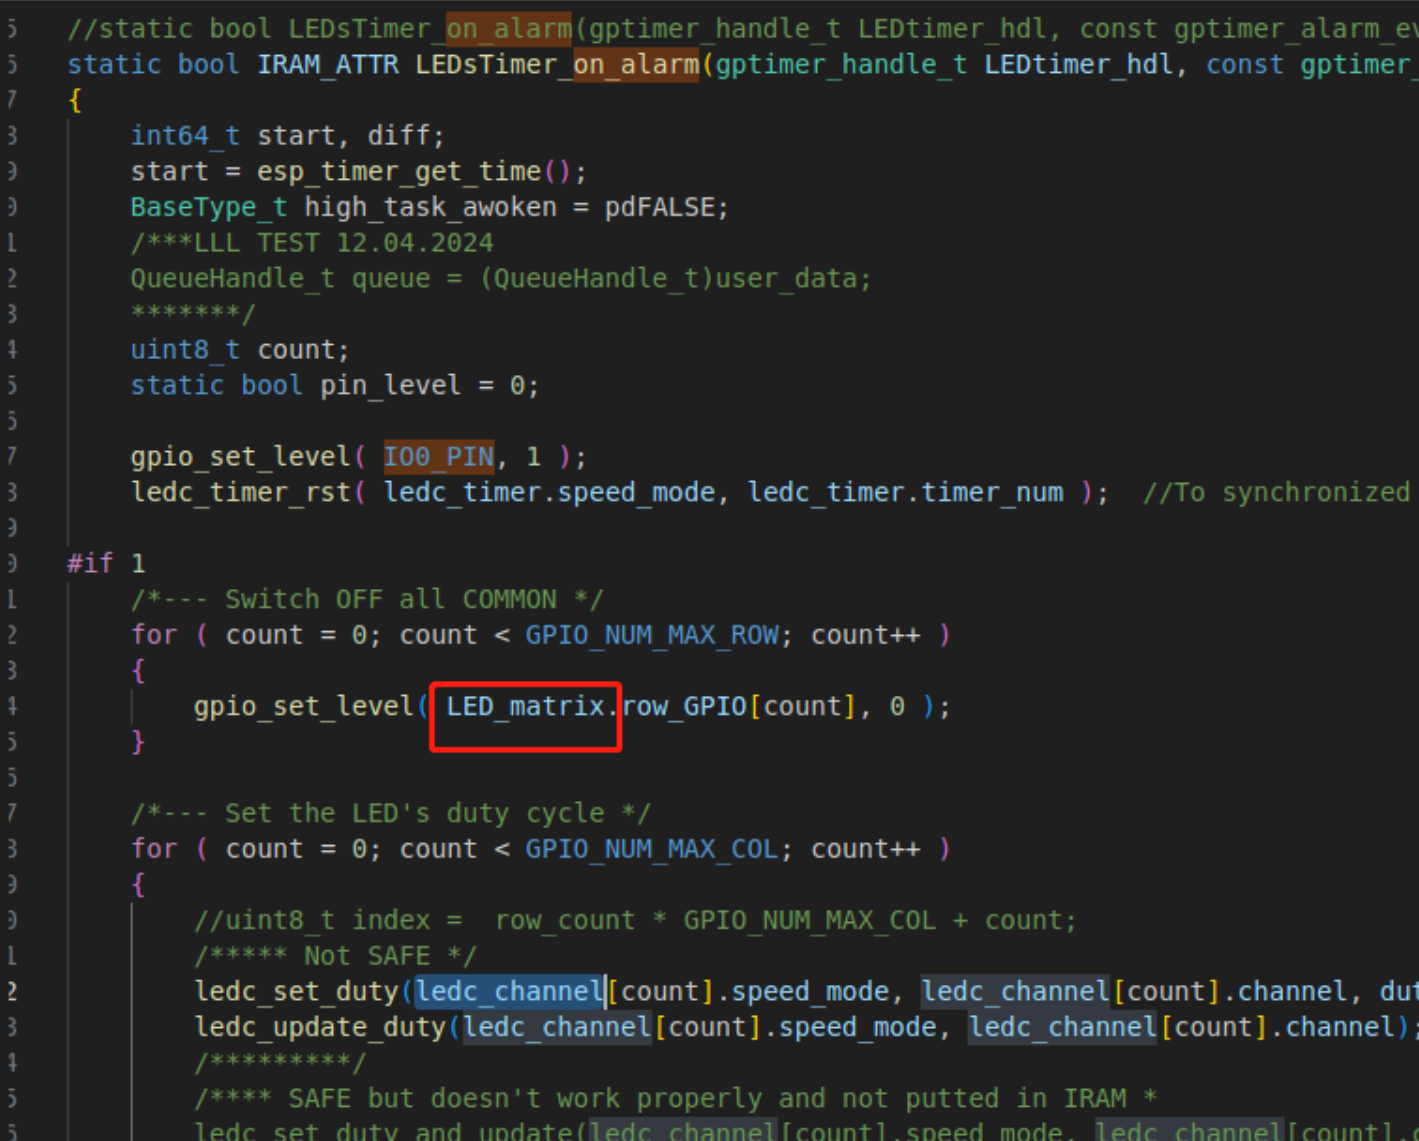
After analysis, it was finally found that the problem was caused by the input parameter LED_matrix of the function gpio_set_level being decorated with const. The parameters decorated with const will be placed in the .rodata section of flash, so reading this parameter requires cache.
Precautions
The exception of Cache disable is better captured on the Xtensa platform, and may appear as other errors caused by the inability to read data from the cache on the RISC-V platform, such as Illegal instruction. The code example is as follows:
gpio_set_level(12, 1);
spi_flash_disable_interrupts_caches_and_other_cpu();
gpio_set_level(12, 0);
When running in ESP32-C3 (RISC-V platform), the crash is as follows
Guru Meditation Error: Core  0 panic'ed (Illegal instruction). Exception was unhandled.

Core  0 register dump:
Stack dump detected
MEPC    : 0x42006ef2  RA      : 0x40381e7e  SP      : 0x3fc8f7f0  GP      : 0x3fc8b400
0x42006ef2: gpio_set_level at /home/jacques/sdk/esp-idf/components/driver/gpio/gpio.c:233
0x40381e7e: cache_access_test_func at /home/jacques/useful_example/crash_test/main/hello_world_main.c:50
TP      : 0x3fc87d4c  T0      : 0x4005890e  T1      : 0x20000000  T2      : 0x00000000
S0/FP   : 0x3c023000  S1      : 0x00000000  A0      : 0x0000000c  A1      : 0x00000000
A2      : 0x00000200  A3      : 0x00000200  A4      : 0x600c4000  A5      : 0x00000000
A6      : 0x60023000  A7      : 0x0000000a  S2      : 0x00000000  S3      : 0x00000000
S4      : 0x00000000  S5      : 0x00000000  S6      : 0x00000000  S7      : 0x00000000
S8      : 0x00000000  S9      : 0x00000000  S10     : 0x00000000  S11     : 0x00000000
T3      : 0x00000000  T4      : 0x00000000  T5      : 0x00000000  T6      : 0x00000000
MSTATUS : 0x00001881  MTVEC   : 0x40380001  MCAUSE  : 0x00000002  MTVAL   : 0x00000000
Interrupt wdt timeout on CPU0/CPU1
Exception Principle
The interrupt watchdog uses the hardware watchdog timer on Timer group 1 to monitor system task scheduling by incorporating a dog-feeding operation in the SysTick interrupt. If the dog-feeding operation is not executed within the SysTick interrupt for an extended period (default 300 ms), the interrupt watchdog interrupt is triggered. For more information, please refer to Interrupt Watchdog Timer (IWDT).
Test Case
This issue can be triggered by disabling the interrupt. The test code is as follows:
static portMUX_TYPE s_init_spinlock = portMUX_INITIALIZER_UNLOCKED;
static void interrupt_wdt_fault_task(void* arg)
{
portENTER_CRITICAL(&s_init_spinlock);
while (1) {
}
}
void app_main(void)
{
printf("Test interrupt watchdog!\n");
xTaskCreate(interrupt_wdt_fault_task, "interrupt_wdt_fault_task", 1024 * 2, NULL, 8, NULL);
}
Exception Phenomenon
RISC-V
Guru Meditation Error: Core  0 panic'ed (Interrupt wdt timeout on CPU0).

Core  0 register dump:
Stack dump detected
MEPC    : 0x42006964  RA      : 0x42006964  SP      : 0x3fc911a0  GP      : 0x3fc8b400
0x42006964: interrupt_wdt_fault_task at /home/jacques/useful_example/crash_test/main/hello_world_main.c:121 (discriminator 1)

TP      : 0x3fc8971c  T0      : 0x00000000  T1      : 0x00000000  T2      : 0x00000000
S0/FP   : 0x00000000  S1      : 0x00000000  A0      : 0x00000001  A1      : 0x00000000
A2      : 0x00000000  A3      : 0x00000004  A4      : 0x00000001  A5      : 0x3fc8c000
A6      : 0x00000000  A7      : 0x00000000  S2      : 0x00000000  S3      : 0x00000000
S4      : 0x00000000  S5      : 0x00000000  S6      : 0x00000000  S7      : 0x00000000
S8      : 0x00000000  S9      : 0x00000000  S10     : 0x00000000  S11     : 0x00000000
T3      : 0x00000000  T4      : 0x00000000  T5      : 0x00000000  T6      : 0x00000000
MSTATUS : 0x00001881  MTVEC   : 0x40380001  MCAUSE  : 0x00000018  MTVAL   : 0x0000a001
Xtensa
Guru Meditation Error: Core  0 panic'ed (Interrupt wdt timeout on CPU0).

Core  0 register dump:
PC      : 0x40378b06  PS      : 0x00060634  A0      : 0x82002239  A1      : 0x3fc984f0
0x40378b06: esp_cpu_wait_for_intr at /home/jacques/sdk/esp-idf/components/esp_hw_support/cpu.c:110

A2      : 0x00000000  A3      : 0x00000000  A4      : 0x3fc96c70  A5      : 0x3fc96c50
A6      : 0x42005e10  A7      : 0x00000000  A8      : 0x82009452  A9      : 0x3fc984b0
0x42005e10: timer_task at /home/jacques/sdk/esp-idf/components/esp_timer/src/esp_timer.c:470

A10     : 0x00000000  A11     : 0x00000000  A12     : 0x3fc96c50  A13     : 0x3fc96c30
A14     : 0x00000000  A15     : 0x00000000  SAR     : 0x00000000  EXCCAUSE: 0x00000005
EXCVADDR: 0x00000000  LBEG    : 0x00000000  LEND    : 0x00000000  LCOUNT  : 0x00000000


Backtrace: 0x40378b03:0x3fc984f0 0x42002236:0x3fc98510 0x4037b5a9:0x3fc98530 0x40379e71:0x3fc98550
0x40378b03: xt_utils_wait_for_intr at /home/jacques/sdk/esp-idf/components/xtensa/include/xt_utils.h:81
 (inlined by) esp_cpu_wait_for_intr at /home/jacques/sdk/esp-idf/components/esp_hw_support/cpu.c:101
0x42002236: esp_vApplicationIdleHook at /home/jacques/sdk/esp-idf/components/esp_system/freertos_hooks.c:59
0x4037b5a9: prvIdleTask at /home/jacques/sdk/esp-idf/components/freertos/FreeRTOS-Kernel/tasks.c:4269 (discriminator 1)
0x40379e71: vPortTaskWrapper at /home/jacques/sdk/esp-idf/components/freertos/FreeRTOS-Kernel/portable/xtensa/port.c:149

Core  1 register dump:
PC      : 0x42007c32  PS      : 0x00060034  A0      : 0x80379e74  A1      : 0x3fc99f20
0x42007c32: interrupt_wdt_fault_task at /home/jacques/useful_example/crash_test/main/hello_world_main.c:121 (discriminator 1)

A2      : 0x00000000  A3      : 0x00000000  A4      : 0x00000001  A5      : 0x00000000
A6      : 0x00000001  A7      : 0x00000000  A8      : 0x82007c32  A9      : 0x3fc99ef0
A10     : 0x00000001  A11     : 0x3fc93a54  A12     : 0x00060020  A13     : 0x00060023
A14     : 0x00060323  A15     : 0x0000abab  SAR     : 0x00000000  EXCCAUSE: 0x00000005
EXCVADDR: 0x00000000  LBEG    : 0x00000000  LEND    : 0x00000000  LCOUNT  : 0x00000000


Backtrace: 0x42007c2f:0x3fc99f20 0x40379e71:0x3fc99f40
0x42007c2f: vPortEnterCritical at /home/jacques/sdk/esp-idf/components/freertos/FreeRTOS-Kernel/portable/xtensa/include/freertos/portmacro.h:573
 (inlined by) interrupt_wdt_fault_task at /home/jacques/useful_example/crash_test/main/hello_world_main.c:120
0x40379e71: vPortTaskWrapper at /home/jacques/sdk/esp-idf/components/freertos/FreeRTOS-Kernel/portable/xtensa/port.c:149
Analysis Method
In case of such problems, primarily observe the PC address of the exception to determine the location of the crash trigger. For multi-core architectures, it is necessary to observe the registers of several cores and analyze the methods that trigger the problem.
The possible reasons and specific explanations are as follows:
Long time interrupt off
Blocking issue exists in ISR function
Interrupt not cleared
Long time interrupt off
Turning off the interrupt is designed to protect critical code sections from being interrupted. However, long time interrupt off is a primary cause of triggering the interrupt watchdog.
As in Test Case, operations like entering a critical section, the interrupt is turned off, preventing the SysTick interrupt from executing the watchdog feeding operation in time. This leads to an interrupt watchdog timeout and triggers the watchdog exception handler. Users must troubleshoot the logic of interrupt disabling in the problematic code area.
Blocking in ISR function
When an interrupt occurs, the corresponding ISR is called for processing. ISR functions should perform minimal operations, deferring time-consuming tasks to non-interrupt functions. If an ISR takes too long to execute or blocks, it may trigger the interrupt watchdog.
Here is a simple example of GPIO ISR blocking:
#define GPIO_INPUT_IO_0     4

static void IRAM_ATTR gpio_isr_handler(void* arg)
{
    ets_printf("ISR\n");
    while(1){}
}

void app_main(void)
{
    gpio_config_t io_conf;
    io_conf.intr_type = GPIO_INTR_POSEDGE;
    io_conf.pin_bit_mask = (1ULL<<GPIO_INPUT_IO_0);
    io_conf.mode = GPIO_MODE_INPUT;
    io_conf.pull_up_en = 1;
    gpio_config(&io_conf);

    gpio_install_isr_service(0);
    gpio_isr_handler_add(GPIO_INPUT_IO_0, gpio_isr_handler, (void*) GPIO_INPUT_IO_0);
}
Manually pull up GPIO 4 to trigger the GPIO interrupt, and print the following crash information:
ISR
Guru Meditation Error: Core  0 panic'ed (Interrupt wdt timeout on CPU0).
Core  0 register dump:
PC      : 0x40082580  PS      : 0x00060034  A0      : 0x80081560  A1      : 0x3ffb07c0
0x40082580: gpio_isr_handler at /home/jacques/problem/wdt/int_wdt/build/../main/hello_world_main.c:40 (discriminator 1)

A2      : 0x00000004  A3      : 0x3ff0015c  A4      : 0x800d6d82  A5      : 0x3ffb3400
A6      : 0x00000000  A7      : 0x00000001  A8      : 0x80082580  A9      : 0x3ffb0730
A10     : 0x00000004  A11     : 0x00000004  A12     : 0x00000004  A13     : 0x00000000
A14     : 0x00000000  A15     : 0x3ffb3400  SAR     : 0x0000001c  EXCCAUSE: 0x00000005
EXCVADDR: 0x00000000  LBEG    : 0x00000000  LEND    : 0x00000000  LCOUNT  : 0x00000000
Core  0 was running in ISR context:
EPC1    : 0x400d1097  EPC2    : 0x00000000  EPC3    : 0x00000000  EPC4    : 0x40082580
0x400d1097: uart_hal_write_txfifo at /home/jacques/sdk/esp-idf/components/hal/uart_hal_iram.c:35

0x40082580: gpio_isr_handler at /home/jacques/problem/wdt/int_wdt/build/../main/hello_world_main.c:40 (discriminator 1)

Backtrace:0x4008257d:0x3ffb07c0 0x4008155d:0x3ffb07e0 0x40082102:0x3ffb0800 0x400d6702:0x3ffb3450 0x400862a2:0x3ffb3470 0x40087865:0x3ffb3490
Through the PC and Backtrace, we can confirm that the problem occurs in the gpio_isr_handle function. In addition, the log line Core 0 was running in ISR context also indicates that it is currently running in the interrupt function.
Interrupt not cleared
After the ISR function ends, the corresponding interrupt must be manually cleared. If it is not cleared at this time, the interrupt will keep triggering, preventing the SysTick interrupt from responding.
As in the example Blocking in ISR function, if you remove the while(1) loop in gpio_isr_handler, and comment out gpio_hal_clear_intr_status_bit in the ESP-IDF GPIO driver, recompiling and running the program will still trigger the interrupt watchdog crash.
If the user has not modified the default driver, interrupt clearing is usually handled by the lower-layer driver. If an interrupt watchdog exception points to the internal driver, check whether the lower-layer driver properly clears the interrupt.
Real Case
Example 1: Interrupt Watchdog Caused by FreeRTOS System Exception
In practical applications, interrupt watchdog issues often do not exist independently, they are usually combined with FreeRTOS. Many operations in FreeRTOS require interrupt handling, and if FreeRTOS encounters an exception, it is prone to freeze and manifest as an interrupt watchdog issue.
The actual crash case example is as follows:
Guru Meditation Error: Core  0 panic'ed (Interrupt wdt timeout on CPU0)
Core 0 register dump:
PC      : 0x400915d2  PS      : 0x00060b34  A0      : 0x800903ed  A1      : 0x3ffd4e80
A2      : 0x3ffd3598  A3      : 0x3ffd4ff0  A4      : 0x00000c9f  A5      : 0x3f408990
A6      : 0x3ffbf580  A7      : 0x00060023  A8      : 0x3ffd4ff0  A9      : 0x0000000f
A10     : 0x3ffd4ff0  A11     : 0x0000000f  A12     : 0x00060b20  A13     : 0x00000001
A14     : 0x3ffeddf0  A15     : 0x3ffea57c  SAR     : 0x00000018  EXCCAUSE: 0x00000005
EXCVADDR: 0x00000000  LBEG    : 0x400014fd  LEND    : 0x4000150d  LCOUNT  : 0xfffffffe

ELF file SHA256: eadf38922e335ed1

Backtrace: 0x400915cf:0x3ffd4e80 0x400903ea:0x3ffd4ea0 0x4008f514:0x3ffd4ec0 0x400ffb91:0x3ffd4f00 0x40136612:0x3ffd4f30
Analyzing the Backtrace information, as follows:
~$ xtensa-esp32-elf-addr2line -afe esp32_interrupt_wdt.elf 0x400915cf:0x3ffd4e80 0x400903ea:0x3ffd4ea0 0x4008f514:0x3ffd4ec0 0x400ffb91:0x3ffd4f00 0x40136612:0x3ffd4f30
0x400915cf
vListInsert
/arm/esp-idf/components/freertos/list.c:205
0x400903ea
vTaskPlaceOnEventList
/arm/esp-idf/components/freertos/tasks.c:2901 (discriminator 2)
0x4008f514
xQueueGenericReceive
/arm/esp-idf/components/freertos/queue.c:1596
0x400ffb91
arch_os_mbox_fetch
/arm/components/esp32/arch_os.c:352 (discriminator 4)
0x40136612
msg_fetch_block
/arm/components/libs/d0/delayzero.c:631
From the above log, the problem is not a crash in the interrupt, but points to FreeRTOS itself. By searching for vListInsert, it shows that the problem occurs in the following for loop:
if( xValueOfInsertion == portMAX_DELAY )
{
    pxIterator = pxList->xListEnd.pxPrevious;
}
else
{
    for( pxIterator = ( ListItem_t * ) &( pxList->xListEnd ); pxIterator->pxNext->xItemValue <= xValueOfInsertion; pxIterator = pxIterator->pxNext )
    {
        /* There is nothing to do here, just iterating to the wanted
        insertion position. */
    }
}
Further check whether the corresponding upper-layer code has interrupt operations at this moment. Finally in vTaskPlaceOnEventList, it shows that interrupts are indeed disabled before performing the list insertion operation.
void vTaskPlaceOnEventList( List_t * const pxEventList, const TickType_t xTicksToWait )
{
    configASSERT( pxEventList );
    taskENTER_CRITICAL(&xTaskQueueMutex);

    vListInsert( pxEventList, &( pxCurrentTCB[xPortGetCoreID()]->xEventListItem ) );

    prvAddCurrentTaskToDelayedList( xPortGetCoreID(), xTicksToWait);
    taskEXIT_CRITICAL(&xTaskQueueMutex);
}
For now the analysis is complete. This issue is a FreeRTOS problem that manifests as an interrupt watchdog. To troubleshoot this type of issue, we need to analyze why it no longer exits in the for loop. It is unlikely that the issue lies with FreeRTOS itself, rather, it is typically caused by improper use of the upper-layer application code, such as memory stomping, blocking operations within interrupts, or similar issues.
Analysis Techniques and Considerations
Quickly Determine the Problem Type
After encountering a watchdog issue, if the crash information includes
Core X was running in ISR context, it essentially indicates that the problem lies within the interrupt function. Conversely, it suggests that the issue is due to the disabling of interrupts.Complexity of System-Related Issues
In actual applications, the interrupt watchdog does not exist independently, it is generally combined with the system. Many operations in FreeRTOS require interrupt handling, and if the system encounters an exception, it can easily get stuck, manifesting as an interrupt watchdog issue.
Other Practical Example References
Appendix 1 - ESP Disassembly Corresponding Instructions
Xtensa ESP32 :
xtensa-esp32-elf-objdump -S xxx.elf > a.txtXtensa ESP32-S2 :
xtensa-esp32s2-elf-objdump -S xxx.elf > a.txtXtensa ESP32-S3 :
xtensa-esp32s3-elf-objdump -S xxx.elf > a.txtRISC-V :
riscv32-esp-elf-objdump -S xxx.elf > a.txt
Where xxx.elf is the project elf file, which is often in the build folder of the project directory. a.txt is the output of the disassembly, which contains the actual assembly instructions.