iPerf Testing Tutorial
Note
This document is automatically translated using AI. Please excuse any detailed errors. The official English version is still in progress.
Table of Contents
This article introduces how to use iPerf to test network bandwidth/throughput, and demonstrates the methods of network performance verification between two ESP32 devices and between ESP32 and a computer.
About iPerf
iPerf is a tool for evaluating network performance, which can test the bandwidth performance of TCP and UDP, measure the maximum throughput, and support various test parameters. Through UDP mode, it can also obtain key indicators such as bandwidth, latency jitter, and packet loss rate, which are used to judge the quality of the link. It is often used to test the data transmission capabilities between two devices, such as network bandwidth and the stability of wireless or wired links.
Here are a few important test result indicators:
Bandwidth refers to the maximum transmission rate of a network link, in bit/s or byte/s. In iPerf test results, bandwidth is represented by Bandwidth. The higher the bandwidth, the better the network performance.
Throughput refers to the actual transmission rate of data in the network, in bit/s or byte/s. In iPerf test results, throughput is represented by Transfer and Bandwidth. The higher the throughput, the better the network performance.
Delay refers to the time it takes for data to be sent from the sender to the receiver, in milliseconds (ms). In iPerf test results, delay is represented by rtt. The lower the delay, the faster the data transmission speed.
Testing Between ESP32 Devices
In the test between ESP32 devices, two ESP32 devices are used, one as a server, responsible for receiving data and counting bandwidth, throughput, delay, and packet loss; the other as a client, sending data streams to the server to measure network link performance. Through TCP or UDP traffic transmission, the network transmission capabilities between the two devices can be evaluated.
Preparation Stage
Use the iPerf example program for testing, and observe the running status, debug information, and test results through the console.
Since the console communicates via UART by default, it is recommended to connect the ESP32 device to the computer via the UART interface to ensure debugging and viewing of output information can be performed.
After entering the directory where the iPerf example is located, enter the following command Set “Target” Chip and run the project configuration tool
menuconfig:idf.py set-target esp32s3 // Replace esp32s3 with the actual chip model used idf.py menuconfig
After entering the
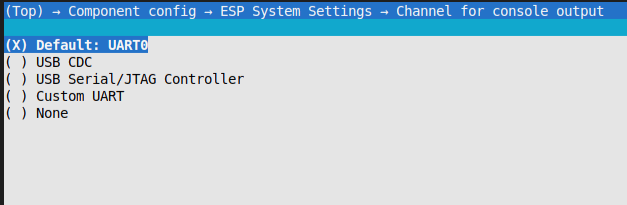
menuconfigpage, confirm or modify the selected interface inComponent config>ESP System Settings>Channel for console output.
After confirming the interface settings, enter the following command to compile and burn the iPerf example program to the ESP32 device for subsequent network performance testing.
idf.py build flash monitor
Note
Since the ESP32 inter-device test uses two ESP32 devices, the above operations need to be performed separately on both devices.
Testing Stage
Note
You can enter help to view the command usage instructions.
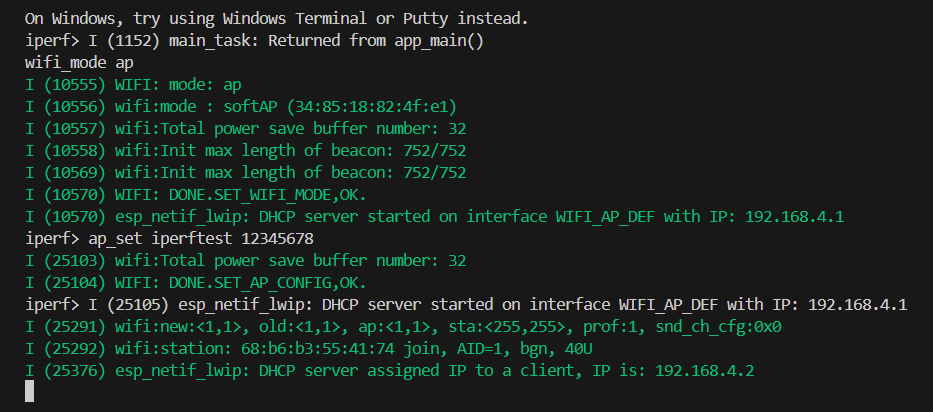
During the test, one ESP32 device needs to be configured in AP mode, and its SSID and password are specified for use as an iPerf server:
wifi_mode ap  // If you are using a version below ESP-IDF v5.4, this line of command can be omitted
ap_set <dut_ap_ssid> <dut_ap_password>
<dut_ap_ssid>: Custom Wi-Fi name<dut_ap_password>: Custom Wi-Fi password
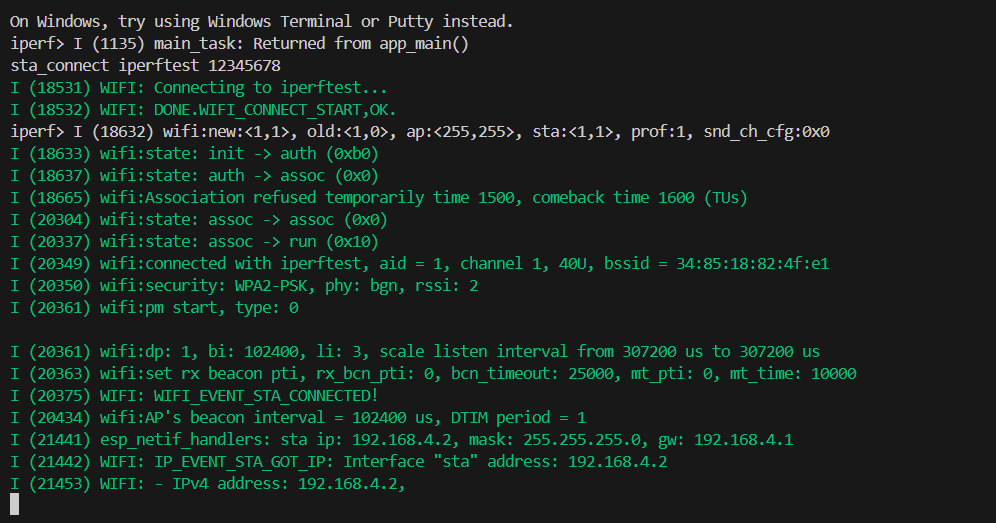
Another device remains in Station (STA) mode (default is STA mode, no additional settings required), acting as a client connecting to the Wi-Fi network created by the server device:
sta_connect <ap_ssid> <ap_password>
<ap_ssid>: The Wi-Fi name to connect to, should be consistent with the previously set AP SSID<ap_password>: The Wi-Fi password to connect to, should be consistent with the previously set AP password
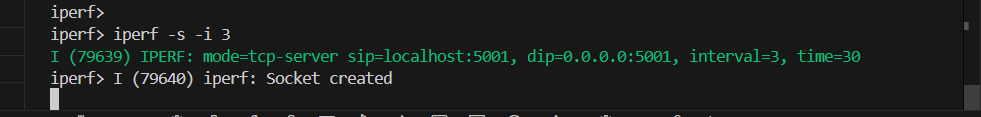
Run iPerf on the AP device, using it as a server:
iperf -s -i 3

/* If you want to enable UDP mode, enter the following command */
iperf -u -s -i 3
-sindicates to start Server mode, the default is TCP mode-uindicates to start UDP mode-i 3indicates to print the rate every 3 seconds
Run iPerf on the STA device, using it as a client:
iperf -c <ap_ip> -i 3 -t 60

/* If the server is in UDP mode, enter the following command */
iperf -u -c <ap_ip> -i 3 -t 60
-cindicates to start Client mode<ap_ip>indicates the IP address of the server device for client connection-t 60indicates a total test time of 60 seconds
Note
The test time can be unspecified, the default is 30 seconds; if specified, the server and client must be consistent.
Test Results
Note
This test result is for reference only, for official test data see Appendix.
When testing between ESP32 devices, both the ESP32 devices acting as client and server will print Bandwidth. The left side of the image below shows server data, and the right side shows client data.
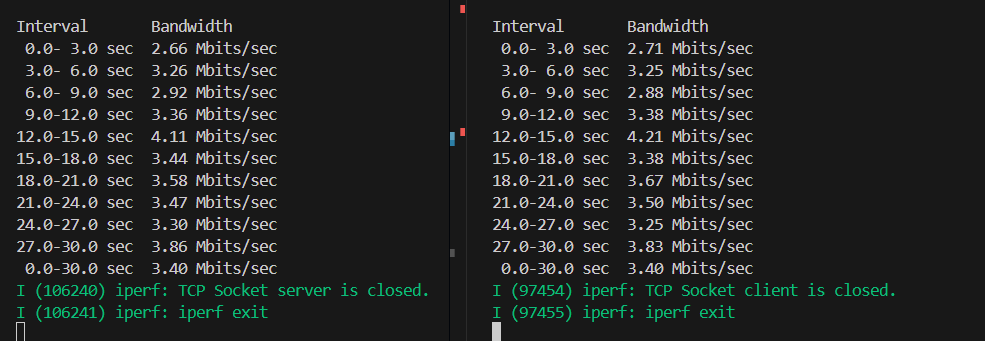
The Bandwidth printed on the server side shows the received traffic (RX), that is, the data rate received by the server from the client, reflecting the actual throughput from the client to the server. Network packet loss or delay will affect the rate displayed on the server side.
The Bandwidth printed on the client side shows the sent traffic (TX), that is, the data rate at which the client sends data to the server, reflecting the actual rate at which the client sends out. If there is a bottleneck in the network or server processing, the rate displayed by the client may be higher than the actual receiving rate of the server.
ESP32 and Computer Testing
In the ESP32 and computer testing, the ESP32 device and the computer are used for network performance measurement. The ESP32 acts as a client to send data, and the computer uses the corresponding iPerf tool to cooperate, assessing the link bandwidth, throughput, latency, and packet loss through TCP or UDP traffic.
Preparation Phase
Use the iPerf example for testing, and observe the running status, debugging information, and test results through the console.
Since the console communicates via UART by default, it is recommended to connect the ESP32 device to the computer via the UART interface to ensure debugging and viewing of output information can be performed.
After entering the directory where the iPerf example is located, enter the following command Set “Target” Chip and run the project configuration tool
menuconfig:idf.py set-target esp32s3 // Replace esp32s3 with the actual chip model used idf.py menuconfig
After entering the
menuconfigpage, confirm or modify the selected interface inComponent config>ESP System Settings>Channel for console output.
After confirming the interface settings, enter the following command to compile and burn the iPerf example program to the ESP32 device for subsequent network performance testing.
idf.py build flash monitor
Computer Side
Install iPerf2 for testing.
Note
When downloading on the computer side, use the iperf2 version, do not use iperf3, because the example is based on iperf2 development.
Save the program to a specified directory, such as
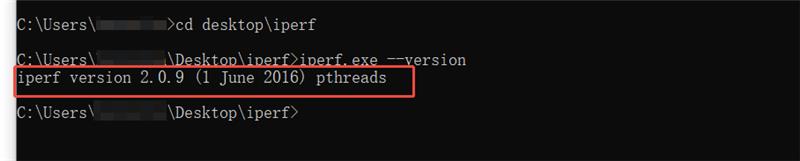
C:\iperf.Open the command prompt (
Win + R> entercmd> Enter), and enter the directory where iPerf2 is located.Enter the following command, if the version number is successfully displayed, it means that the installation and preparation work is completed, if the command is not found or an error is reported, it means that there is a problem with the path or file
iperf.exe --version
Testing Phase
Note
On the ESP32 device side, you can enter
helpto view the command usage instructions.On the computer side, you can enter
iperf --helpto view the command usage instructions.
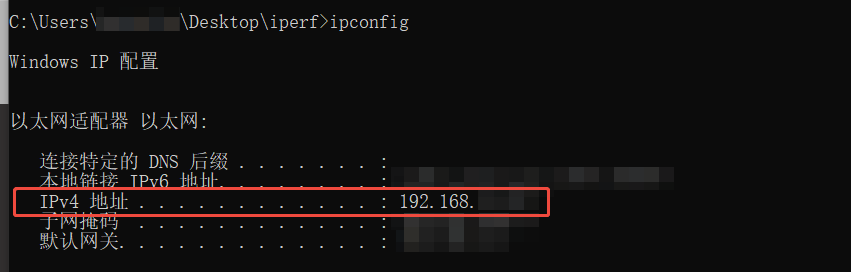
During the test, the computer acts as a server, and you first need to enter ipconfig in cmd to get the computer’s IPv4 address:
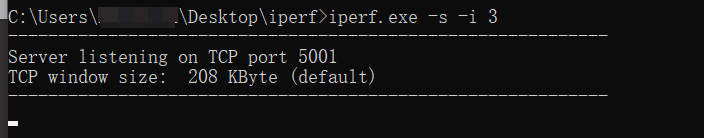
Run iPerf2 as a server on the computer, and the following information indicates that the server has started successfully:
iperf.exe -s -i 3

/* If you want to enable UDP mode, enter the following command */
iperf.exe -u -s -i 3
-sindicates the start of Server mode, the default is TCP mode-uindicates the start of UDP mode-i 3means that the rate is printed every 3 seconds
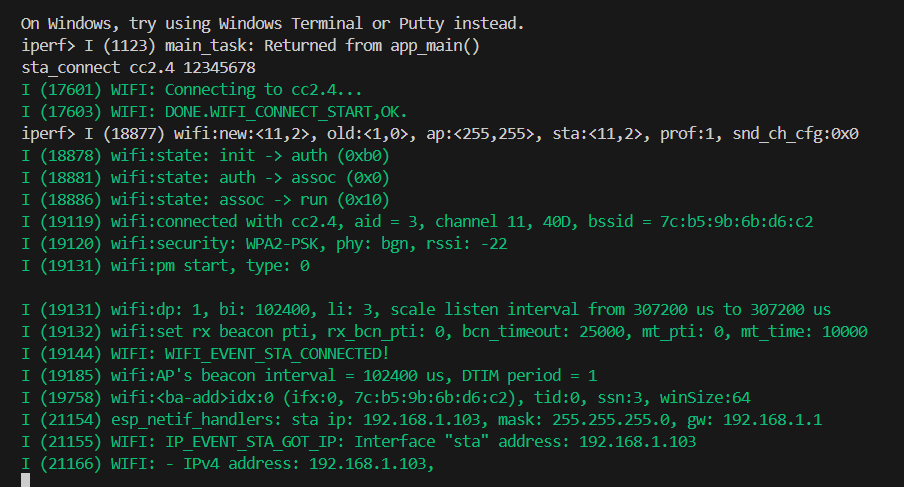
Enter the command on the ESP32 device side to connect to Wi-Fi, making sure it is connected to the same router as the computer.
sta_connect <ap_ssid> <ap_password>
<ap_ssid>: The name of the Wi-Fi to connect to<ap_password>: The password of the Wi-Fi to connect to
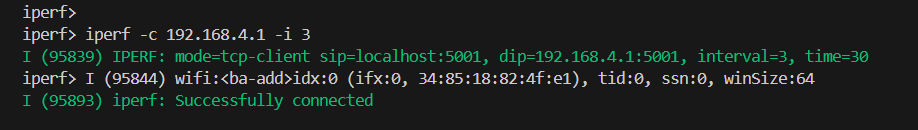
Run iPerf on the ESP32 device side as a client:
iperf -c <IPv4> -i 3 -t 30

/* If the server is in UDP mode, enter the following command */
iperf -u -c <IPv4> -i 3 -t 60
-uindicates to enable UDP mode-cindicates to enable Client mode<IPv4>represents the IP address of the server device for client connection-t 30indicates a total test time of 30 seconds-i 3indicates to print the rate every 3 seconds

Note
The test time can be unspecified, default is 30 seconds; if specified, the server and client need to be consistent.
Test Results
Note
This test result is for reference only, for official test data, see Appendix.
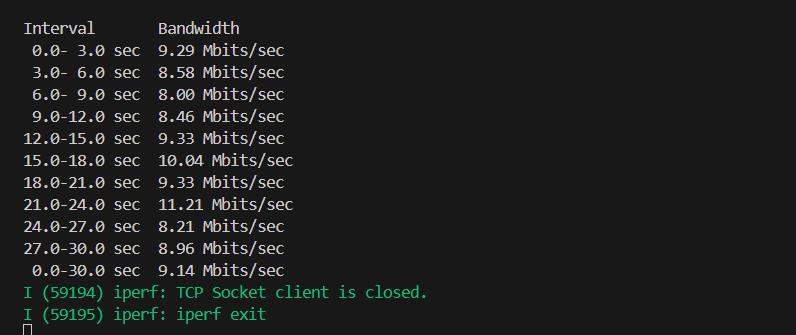
When testing between ESP32 and a computer, the ESP32 device acting as the transmitter (TX) will print Bandwidth, which shows the data rate sent by ESP32 to the other end, reflecting the actual throughput from ESP32 to the computer. Network packet loss or delay will affect the rate counted at the other end.
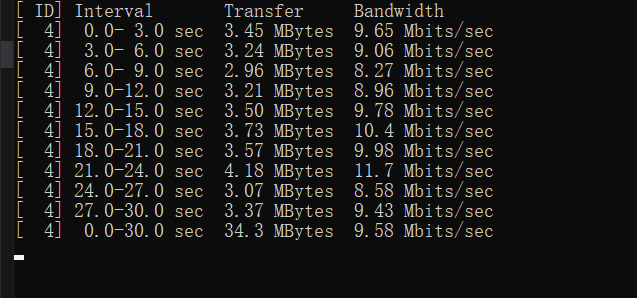
The computer acting as the receiver (RX) will print Transfer and Bandwidth, showing the amount of data received from ESP32 and the receiving rate (RX).
Troubleshooting
When testing between ESP32 and a computer, if the computer enables UDP mode and prompts bind failed: Operation not permitted
This is because Windows has additional security or firewall restrictions on UDP ports, which may prevent port binding. You can switch to another port, such as 5002.
Command reference:
/* Computer command */
iperf.exe -u -s -p 5002 -i 3

/* ESP32 device command */
iperf -u -c <IPv4> -p 5002 -i 3