Wireshark Packet Capture Tutorial on Windows
Note
This document is automatically translated using AI. Please excuse any detailed errors. The official English version is still in progress.
This article provides a detailed tutorial on how to use Wireshark to capture Wi-Fi wireless packets on Windows 10.
Installing Wireshark
About Wireshark
Wireshark (formerly Ethereal) is a network packet analysis tool. This tool is mainly used to capture network packets, automatically parse them, and display detailed information about the packets for user analysis. It can run on both Windows and Linux operating systems. This tool can be used to capture and analyze various protocol packets. This article will explain how to install and use this tool.
Download and Installation
The Kali Linux system comes with the Wireshark tool, but it is not installed by default in the Windows system. Go to the Wireshark official website. Click on Get started to go to the download page.

In the Stable Release section, you can see that the latest version of Wireshark is 4.2.4, and download links for Windows (32-bit and 64-bit), Mac OS, and source code packages are provided. You can download the appropriate software package according to your operating system.
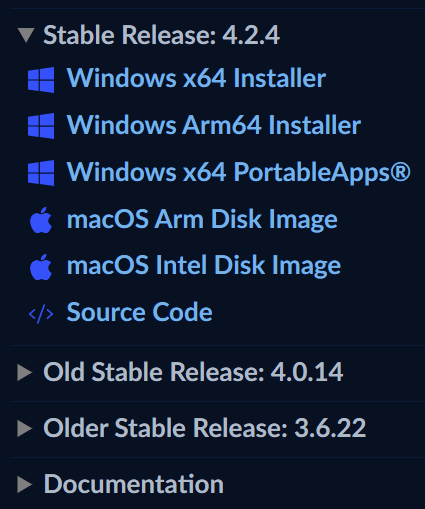
Here we download the 64-bit Windows installation package. Select Windows Installer(64-bit) to download. The downloaded file name is Wireshark-win64-4.2.4.exe. Double-click the downloaded software package to install it. During installation, use the default values and click the Next button. Note that Wireshark will ask the user whether to install the Npcap plugin synchronously (selected by default).
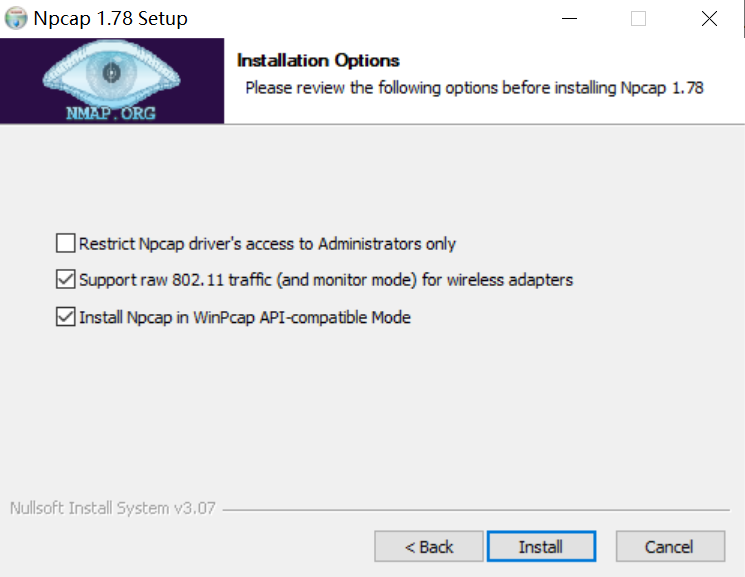
Npcap is an advanced packet capture and network sniffing software tool created by the Nmap project. It is a lightweight but powerful platform that allows users to perform real-time network traffic analysis and monitoring on the Windows operating system. Pay attention to the version of Npcap during this step. The early version of Npcap-1.7.1 could not use cmd to open the network card’s monitor mode, which has been fixed in version 1.76. For more information, refer to source. The latest downloaded Wireshark comes with version 1.78, which can be installed directly.
Attention
Npcap will pop up a second installation page, where you need to check the two options in the figure below (not checked by default), otherwise you will not be able to capture 802.11 packets.
After installation, the Wireshark icon will appear in the Windows Start menu.

Packet Capture Network Card
The primary consideration is that the packet capture network card needs to support Monitor mode, followed by the wireless protocols and transmission rates supported by the network card.
Monitor Mode
Monitor mode, or RFMON (Radio Frequency Monitor), refers to the working mode in which the wireless network card can receive all data streams passing through it, corresponding to other modes of IEEE 802.11 network cards, such as Master (router), Managed (ordinary mode network card), Ad-hoc, etc. Monitor mode does not distinguish the target MAC address of the received packets, which is similar to promiscuous mode. However, unlike promiscuous mode, monitor mode does not require a connection to be established with the wireless access point (AP) or Ad-hoc network. Monitor mode is a special mode unique to wireless network cards, while promiscuous mode applies to both wired and wireless network cards. Monitor mode is commonly used for network discovery, traffic monitoring, and packet analysis (source: Wikipedia).
Determine the Modes Supported by the Network Card
You can use the Npcap tool to view the current mode of the network card, the supported modes, and turn on monitor mode.
Press
win+Ror entercmdin the start menu to open the cmd command prompt window: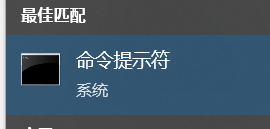
To view the GUID of the network card, enter
netsh wlan show interfaces: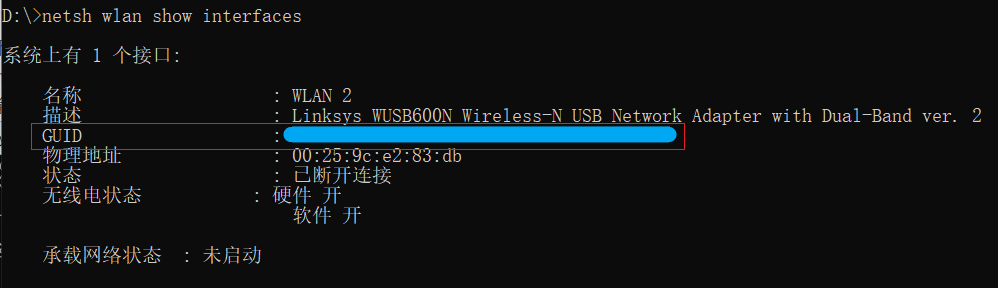
To view the current mode, copy the GUID, then enter
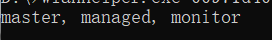
WIanHelper.exe + GUID + modes, for example:wlanhelper.exe 00971d40-8f3c-426d-bab3-5a38ce789c45 modes
You can then view the modes supported by the network card. Many built-in network cards in laptops will only have managed mode, in which case you need to purchase a wireless network card that supports monitor mode separately.
To turn on monitor mode for the network card, enter
WlanHelper.exe + GUID + mode monitor, for example:wlanhelper.exe 00971d40-8f3c-426d-bab3-5a38ce789c45 mode monitor
Success will be indicated by
Success: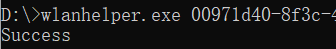
Attention
cmd needs to be opened with administrator privileges, otherwise it will not be able to turn on monitor mode and will report an error. You can also enter
modeto view the current mode. For more usage of WlanHelper, you can enterWlanHelper.exe -hto view.
Network Card Selection
Choose a suitable wireless packet capture card according to your packet capture needs. If you need to capture Wi-Fi 6 packets, you need to choose a wireless card that supports the 802.11 ax protocol. Refer to the following table for the comparison of Wi-Fi protocol versions:
Generation |
IEEE Standard |
Radio Frequency (GHz) |
|---|---|---|
Wi-Fi 6/6E |
802.11ax |
2.4, 5/6 |
Wi-Fi 5 |
802.11ac |
5 |
Wi-Fi 4 |
802.11n |
2.4, 5 |
You can search for keywords such as wireless packet capture and air packet capture card on shopping websites. Generally, cards with packet capture capabilities support monitor mode.
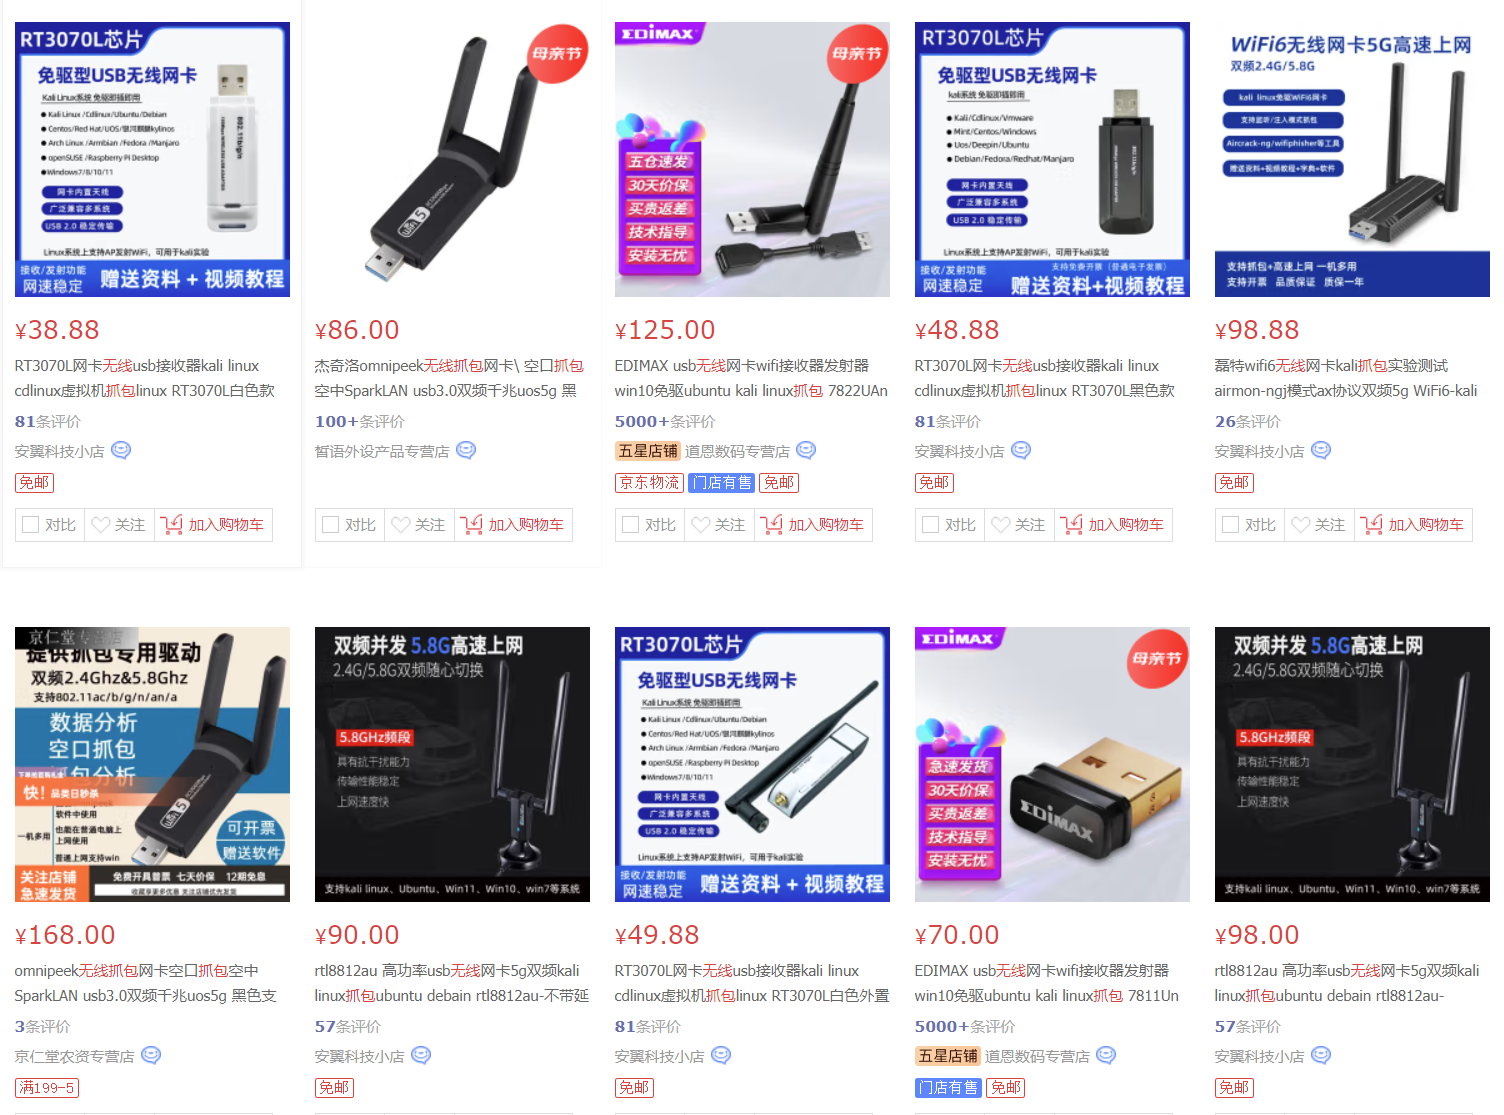
If the product does not provide detailed parameters, but provides the model of the wireless chip used, you can directly search for the model to view the detailed parameters of the chip:
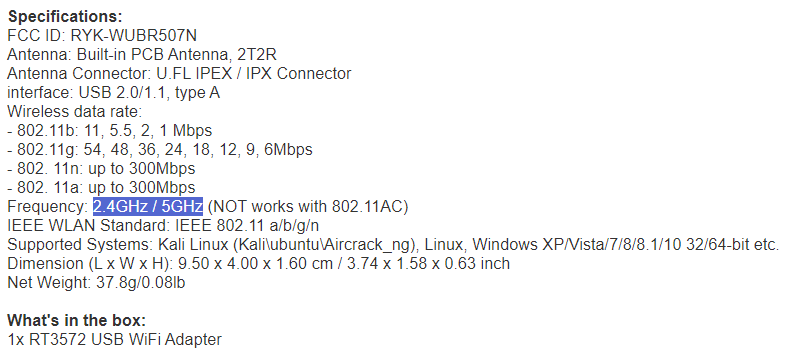
This article takes the Cisco packet capture card with the Ralink RT3572 chip as an example. This chip supports the 802.11n protocol with a maximum rate of 300 Mbps and can capture empty packets of the Wi-Fi 4 protocol.
Configuring the Network Card
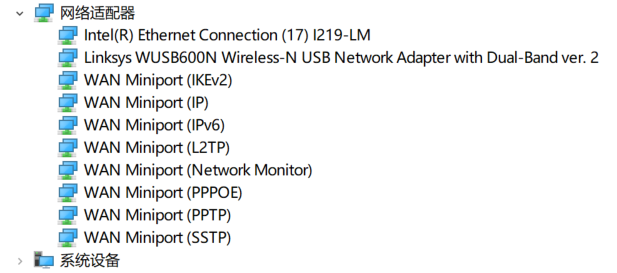
After getting the network card, you need to install the corresponding driver. Some network cards are plug-and-play and do not require installation. After plugging in the network card, open Control Panel - Device Manager , find the newly inserted network card in the Network Adapters column, double-click to view detailed information. If the driver is not compatible, there will be a yellow triangle:
If your network card cannot be used after plugging in, this article introduces three methods to obtain the driver for the network card:
Use the installation method provided by the seller when purchasing the network card, including but not limited to: the seller provides download links and installation methods, and the network card comes with a storage disk with the corresponding driver.
Use third-party one-click installation software such as Driver Genius or Driver Master to automatically install the appropriate driver for the network card.
Search for the model of the network card or the model of the wireless chip, and go to the corresponding chip official website or third-party software to directly download the corresponding driver.
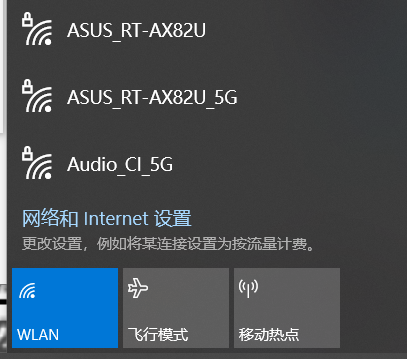
After installation, some network cards need to restart the computer to adapt. After successful installation, open Network Adapter - WLAN in the lower right corner to search for nearby routers:
Capture Packets Using Wireshark
After installing Wireshark, you can run it to capture packets. Start Wireshark:
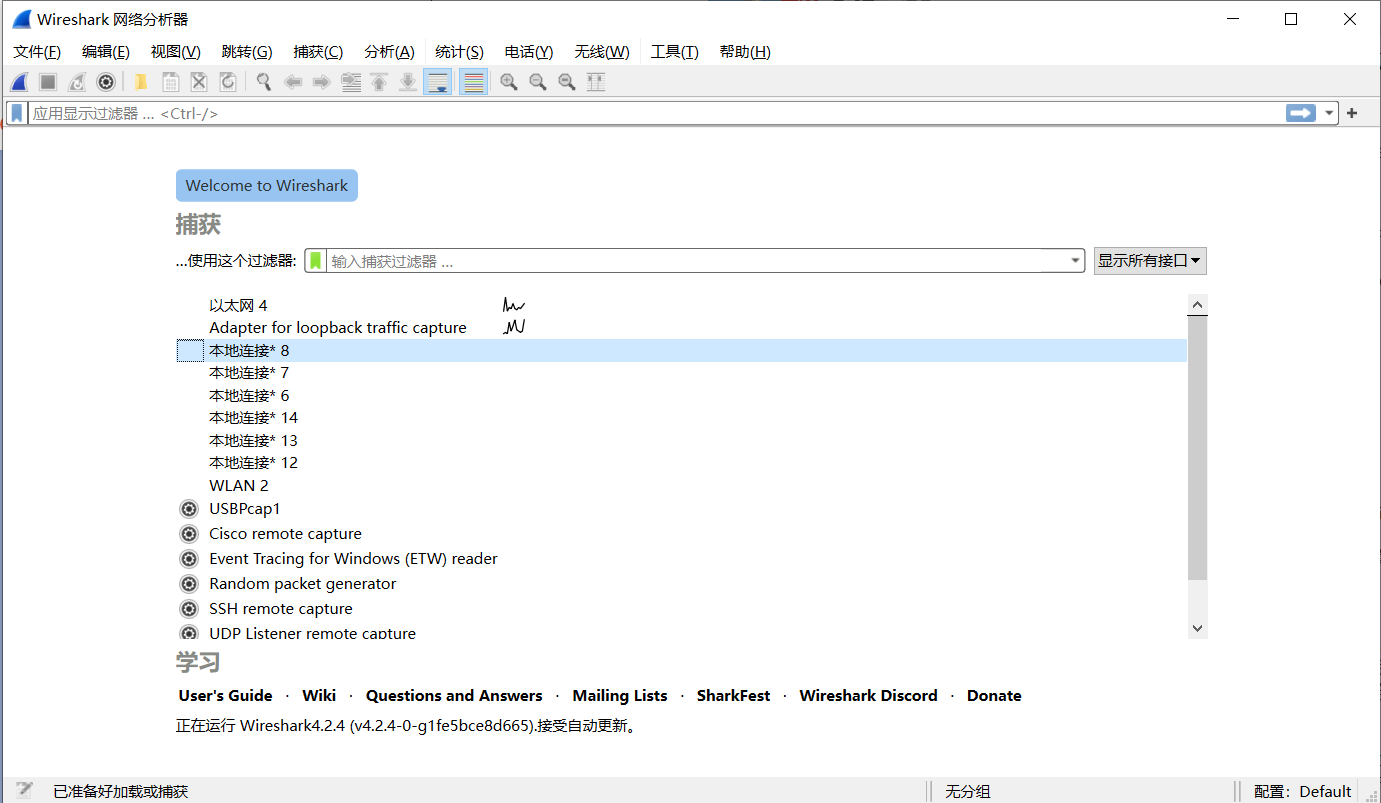
This is the main interface of Wireshark, which displays the currently available interfaces, such as Local Connection 8 , WLAN 2 , etc. To capture packets, you must first select an interface, indicating that the packets on this interface are captured. For basic concepts of network structure and protocols, you can refer to the blog: Understanding the Basic Principles of Wi-Fi Networks.
Capture Ethernet Packets
You can use Wireshark to capture packets from your computer’s network card and analyze the captured packets.
Attention
Loopback data of localhost accessed by the local machine does not go through the network card. To capture loopback data, you need to specify that the loopback data should be forwarded to the gateway first.
Wireshark can open and analyze packet capture files generated by other tools.
Select the Ethernet 4 interface to capture packets. Click on Start Capture at the top left corner or double-click on the interface name to begin capturing network data. While browsing the web on the local computer, Wireshark will capture data on the Local Connection interface.
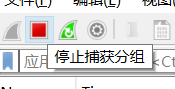
Wireshark will continue to capture data on the Local Connection . If you no longer need to capture, you can click on the Stop Capture button at the top left corner to stop capturing.
Capture Wireless Packets
Set Capture Options
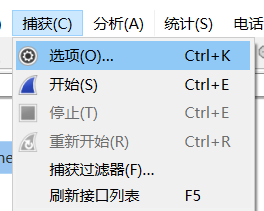
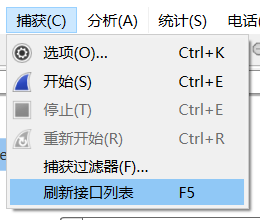
The menu bar Capture-Options (shortcut Ctrl + k ) can enter the capture option setting interface:
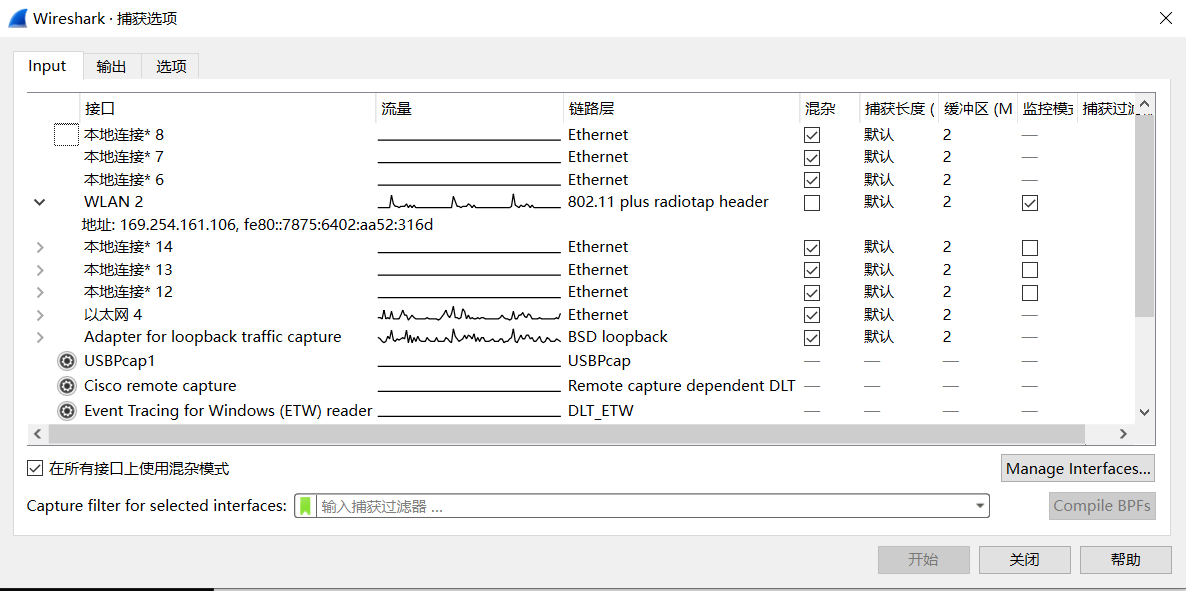
Select the recently configured wireless network card. View the corresponding IP address by opening the drop-down menu:
Attention
The IP address may change before and after connecting to the router. Please get the latest interface information through Capture-Refresh Interface List (shortcut F5):
Select Capture Card
The network interface names configured by different computers may be different. Confirm the wireless network card for packet capture using the following methods:
Method 1
After connecting to a wireless network, use win+R or enter cmd in the start menu to open the cmd command prompt window:
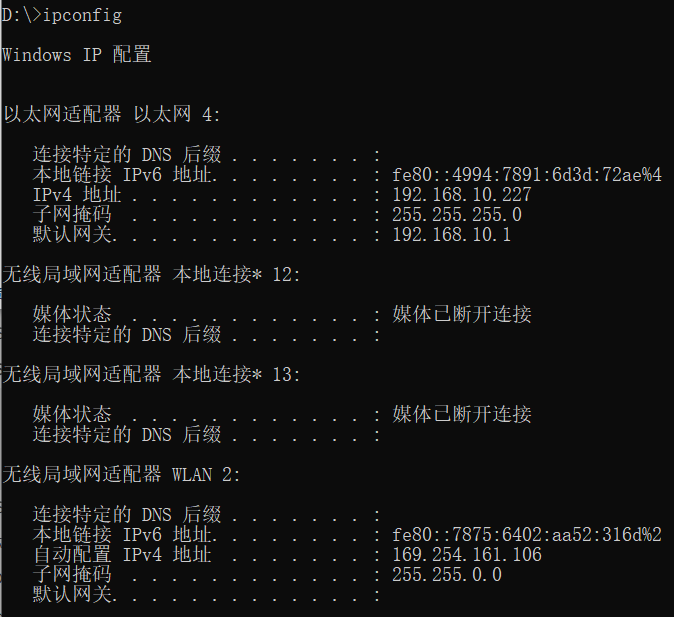
Enter ipconfig in the command bar and press enter, you can see the interface information of the current network, and the corresponding IP address can determine that the wireless network card is WLAN 2:
Method 2
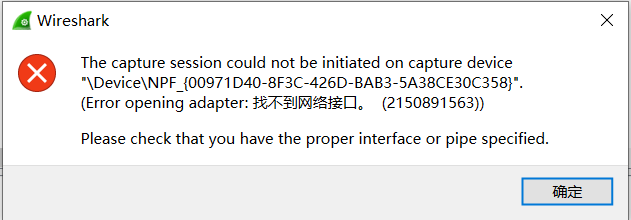
Alternatively, unplug the network card and try capturing with WLAN 2 in Wireshark. If the system prompts that the interface cannot be found, or Menu-Capture-Refresh Interface List, you can also determine the interface name of this network card.
Method 3
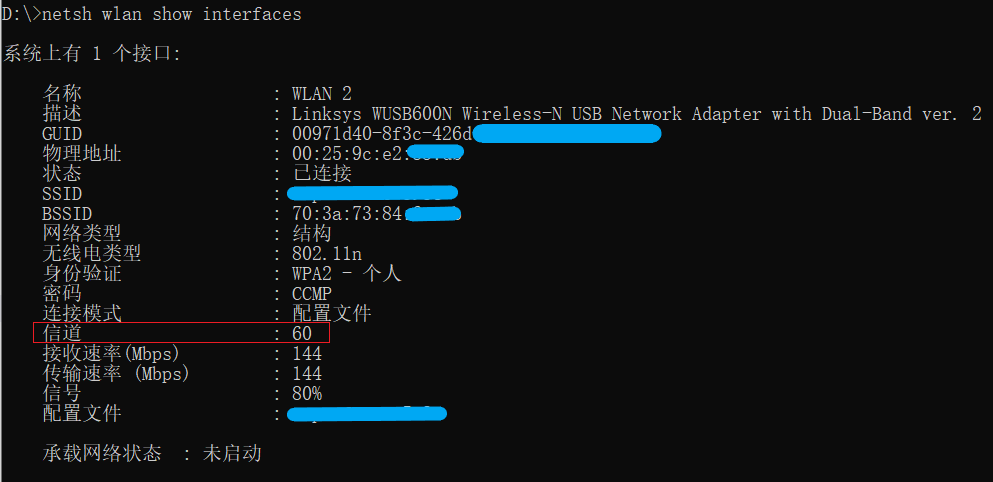
Open the cmd command prompt window, enter netsh wlan show interfaces, and you can view the corresponding wireless network interface information.
Determine the Capture Channel
Select the Wi-Fi channel you need to capture. If you want to capture the interaction information of the router under test, you can confirm the channel, bandwidth, and other information of the router as follows:
Method 1
Open the cmd command prompt window, connect the computer to the router under test, enter netsh wlan show interfaces, and you can view the channel of the current connection.
Method 2
Check in the router administrator settings interface, not expanded here.
Method 3
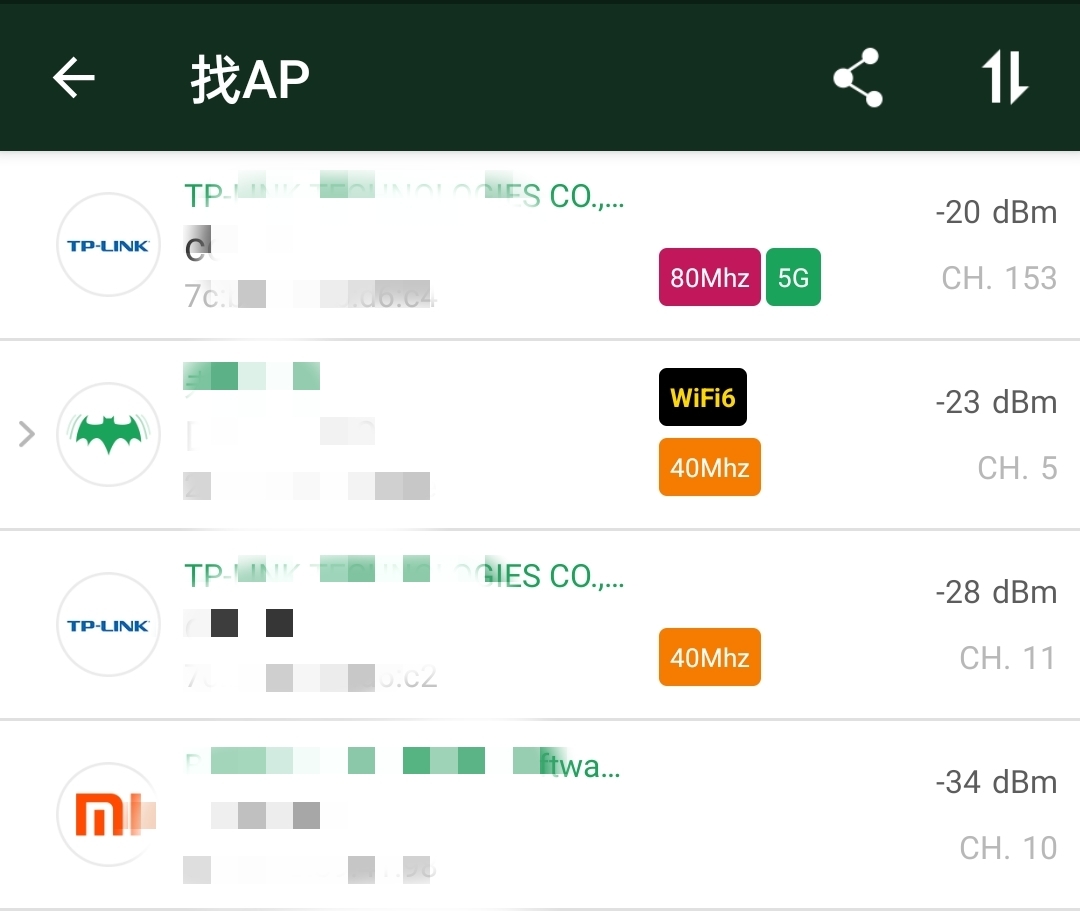
Download Wi-Fi sniffing applications on your phone, such as WiFi Magic Box, wifiman, WiFi Analyzer, inSSIDer, WirelessMon, etc., to view the surrounding AP information and channel analysis.
Set Monitor Channel
Open the cmd command prompt window, follow the method introduced in the previous Determine the Modes Supported by the Network Card section to enable the monitor mode of the network card.
Attention
After opening this mode, the connected network will be disconnected, which is a normal phenomenon, because the common network card mode is managed, and it can be changed back after the subsequent packet capture is completed.
To enable the monitor mode, enter WlanHelper.exe + GUID + mode monitor, for example:
wlanhelper.exe 00971d40-8f3c-426d-bab3-5a38ce789c45 mode monitor
Configure the channel to be monitored, enter WlanHelper.exe + GUID + channel [value], channel 60 for example:
wlanhelper.exe 00971d40-8f3c-426d-bab3-5a38ce789c45 channel 60
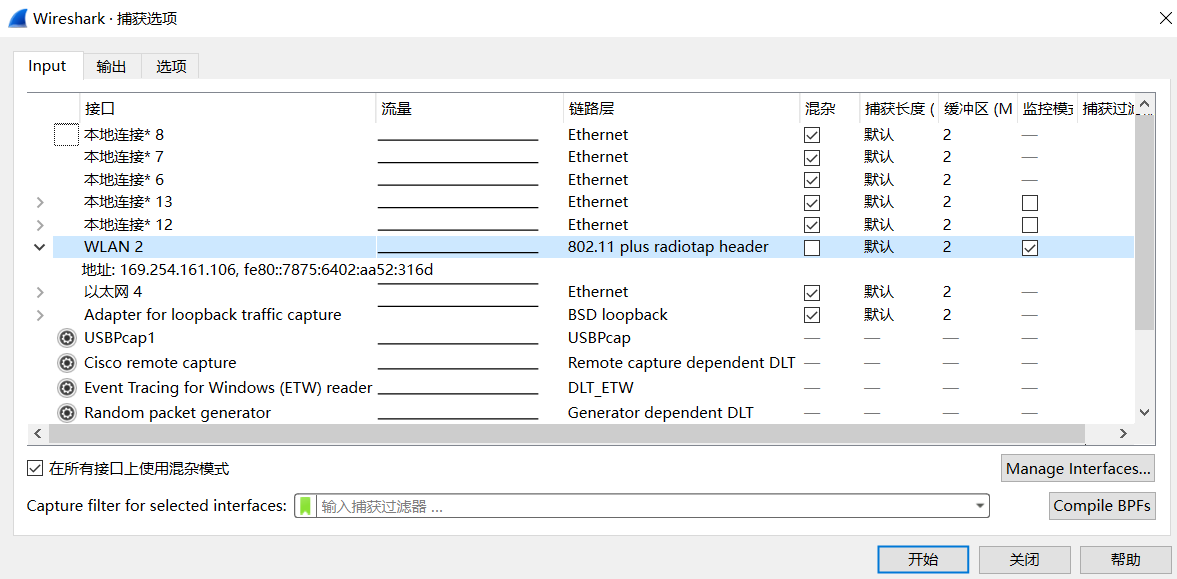
Configure Wireshark capture options
In the input field, select the corresponding network card interface, do not check the promiscuous mode, and check the monitor mode.
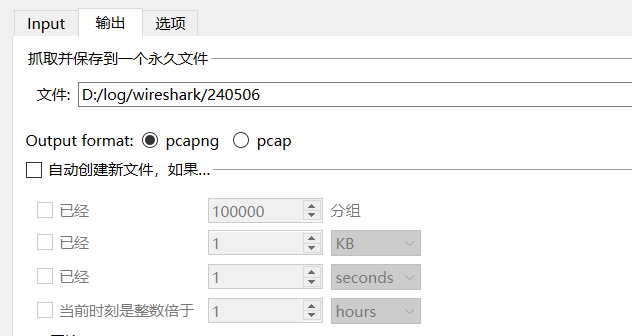
In the output field, select the path to be saved and the format to be stored.
Click Start or double-click the interface name to capture the wireless network data packets.
Usage of Wireshark Filters
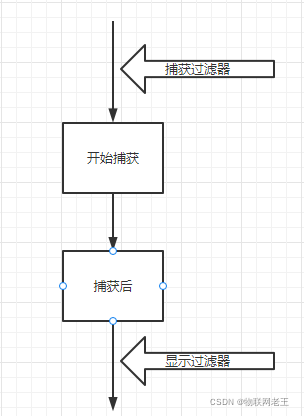
Wireshark has set up two filters: capture filter and display filter.
Capture filter:
Used to set filter conditions before starting capture. After setting the filter conditions, the packet capture tool will only capture packets that match the conditions; using the capture filter can reduce the captured network packets, reduce the burden of packet capture software and storage space, and the final packet capture file is also smaller, which is a necessary skill to improve efficiency;
Display filter:
Used to set filter conditions after capturing data. After setting the filter conditions, only packets that match the conditions will be displayed on the display page, which helps engineers analyze packets.
Basic Usage of Capture Filter
After opening the Wireshark software, the input box shown in the figure is the place to enter the capture filter conditions:
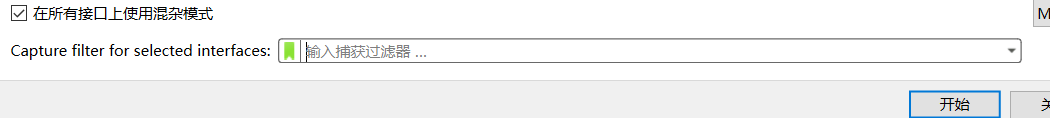
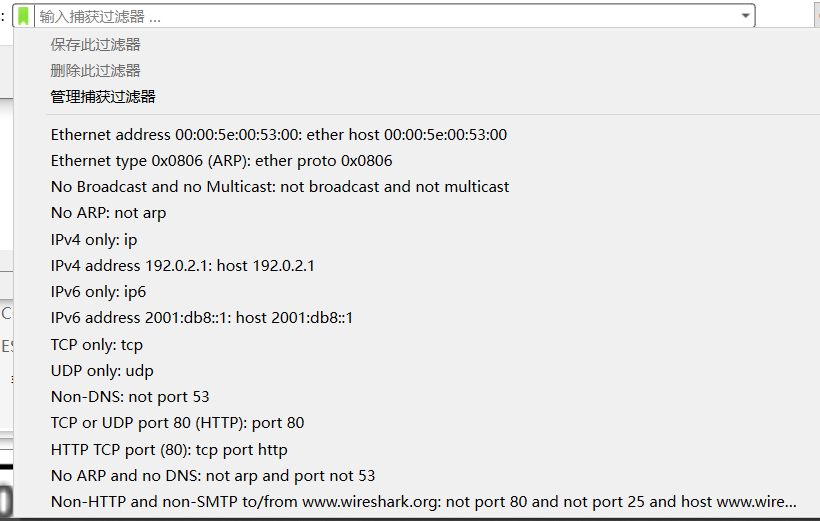
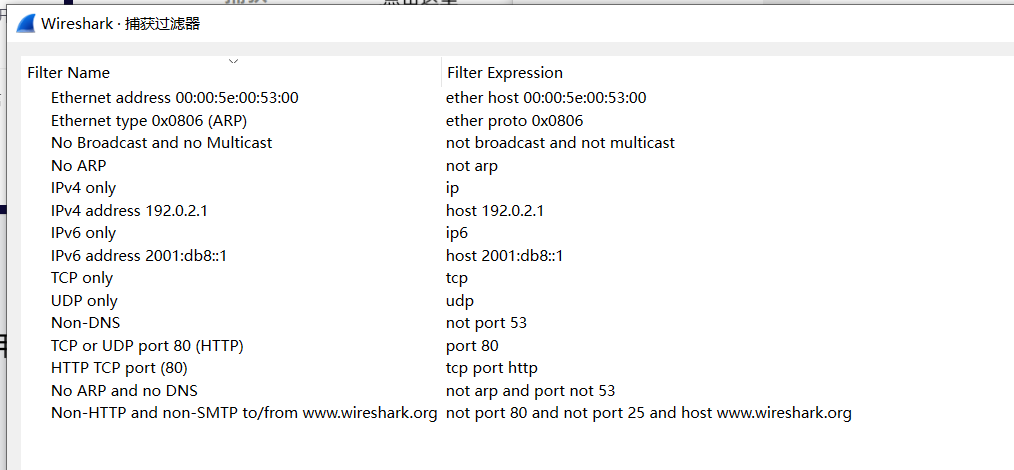
Click on the small green tag in the above figure (or through the menu: Capture - Capture Filters) to open commonly used capture expressions:
Note: The colon : in the capture expression usually means explanatory, without actual meaning.
Syntax of Capture Filter Expressions
Wireshark capture filter expressions follow libpcap syntax. Filter expressions consist of one or more primitives. Primitives are usually composed of an id (name or number) and one or more modifiers.
Filter expression = Primitive 1 + Primitive 2 + …
Primitive = id + Modifier 1 + Modifier 2 + …
Primitives can be combined with logical connectors and parentheses (), including:
And: Can be represented by the symbol
&&or the wordandOr: Can be represented by the symbol
‖or the wordorNot: Can be represented by the symbol
!or the wordnot
For example, this expression captures only packets that pass through the gateway sup and belong to FTP ports or data:
gateway snup and (port ftp or ftp-data)
This example captures no arp type packets:
not arp
This example captures only tcp or udp type packets:
tcp || udp
It’s worth mentioning that this filter comes with syntax checking, and the green frame at the bottom indicates correct syntax.
Note
For more usage and examples of capture filters, please refer to the Wireshark official explanation capture filters wiki and capture filters Gitlab.
Basic Usage of Display Filters
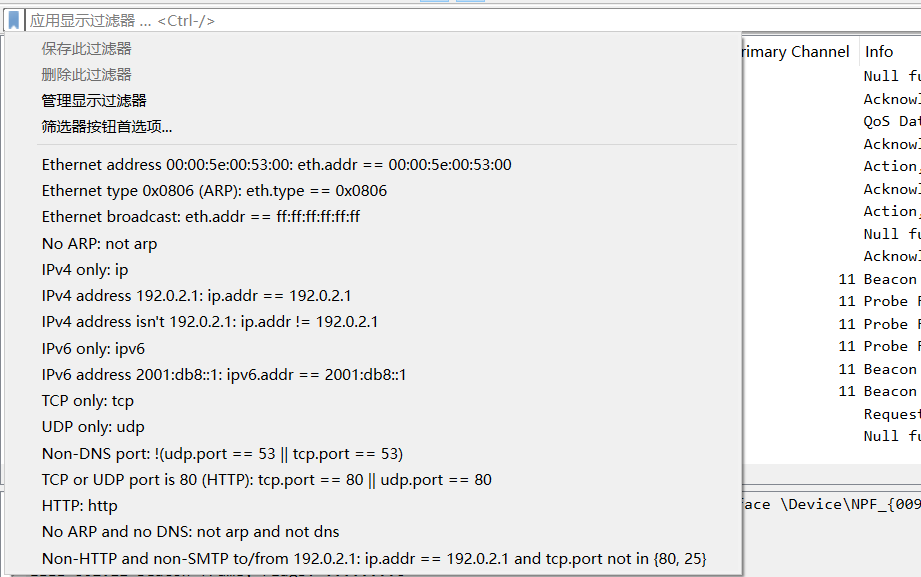
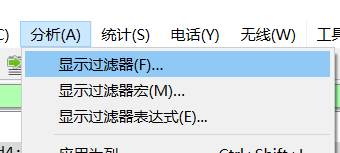
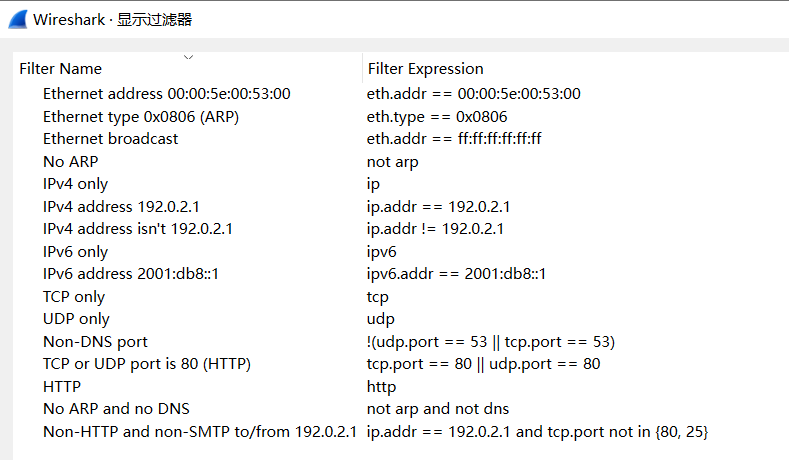
After entering the packet capture page, click on the tag in the figure below, or through the menu Analyze- display filters to open commonly used display filter expressions:
Syntax of Display Filter Expressions
Similar to capture filter expressions, display filter expressions can also be seen as a combination of primitives. The difference is that the primitives of display filter expressions consist of option + option relationship + option value. For example, in tcp.port == 80, tcp.port is the option, == is the option relationship, and 80 is the option value. The entire expression means: only display packets with a tcp port number (including sending and receiving) of 80.
A reminder once again, display filter expressions and capture filter expressions should not be confused. The form of a capture filter expression is: tcp port80. The three parts of the expression are explained as follows:
Option: An option can be a protocol (such as tcp, udp, http, etc.), frame, and other objects. Refer to existing examples or directly input the protocol name to see if there are any prompts.
Option relationship: Used to define the relationship between the option and the option value. Common option relationships are as follows:
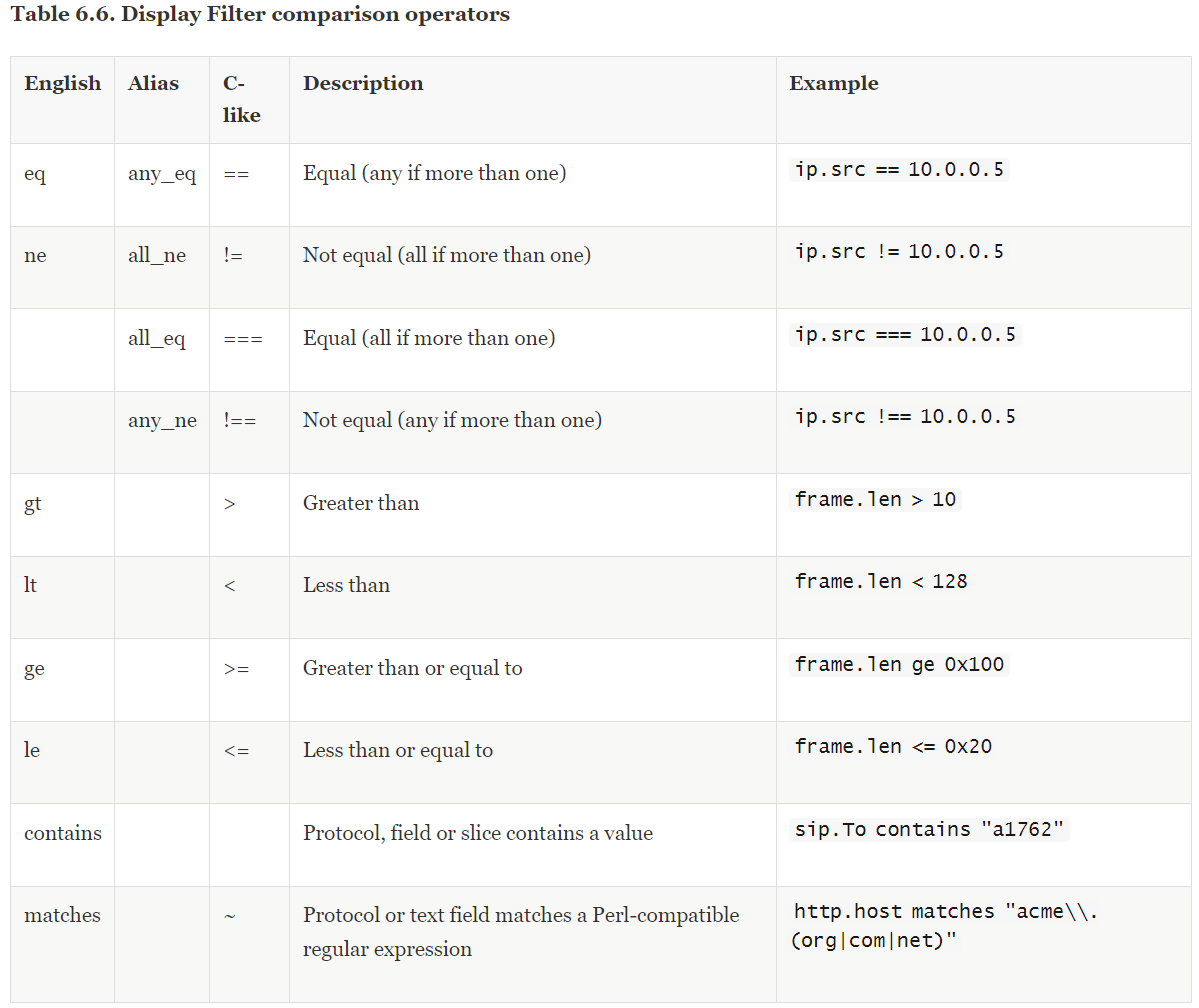
Table source: Wireshark Official Website
Option value: The option value can be a number, such as a decimal number
1500, a hexadecimal number0x5dc, a binary number0b10111011100, a boolean value (where 1 representstrue, 0 representsfalse), a MAC address number (such aseth.dst == ff:ff:ff:ff:ff:ff), an IP address (such asip.addr == 192.168.0.1), a string (such ashttp.request.uri == "https://ww.wireshark.org/"), a time (such asntp.xmt ge "2020-07-0412:34:56"), etc.
Multiple expressions can also be connected by logical connectors to form advanced display filter expressions.
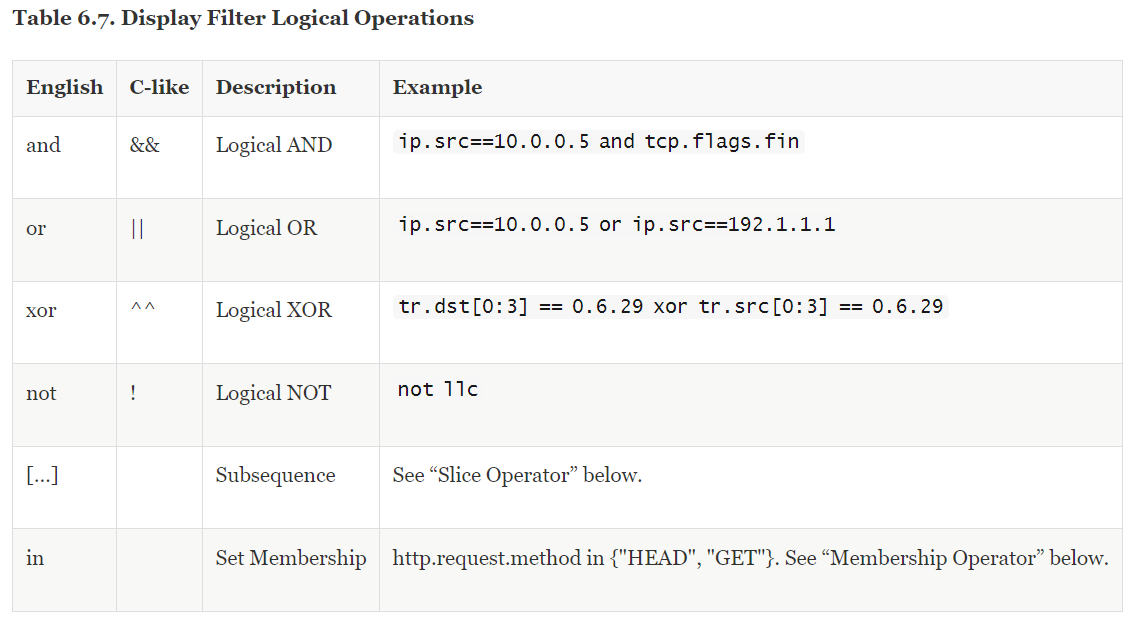
Table source: Wireshark Official Website
Here, […] represents the substring selector, such as eth.src[0:3] == 00:00:83 indicates that the data of the 3 bytes starting from offset address 0 is 00:00:83. The in represents the member selector, commonly used to form a set of option values. For example, tcp.port in {80,441,8081} means to filter the tcp packets with ports 80, 441, 8081. It is equivalent to tcp.port == 80 ‖ tcp.port == 441 ‖ tcp.port == 8081.
Note
For more usage methods and examples of capture filters, please refer to the Wireshark official explanation capture filters wiki and capture filters Gitlab.
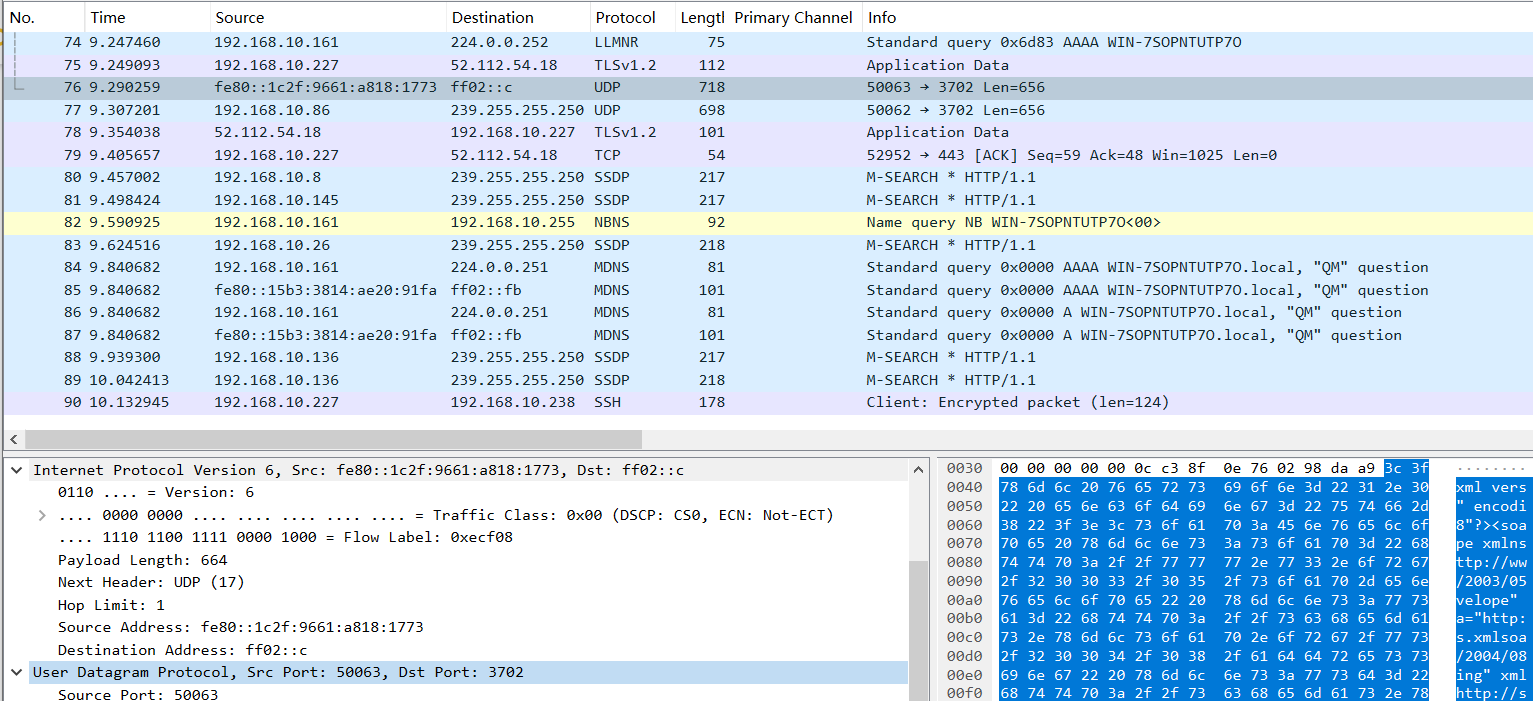
Packet Analysis
After mastering the packet capture method of Wireshark, you can perform preliminary analysis on the captured packets. Here are some excellent packet analysis examples:
Wireshark Packet Capture Analysis of WLAN Connection Process
Using Wireshark to Analyze the Specific Process of Ping Communication
Wireshark Packet Capture Analysis of TCP Three-Way Handshake
At the end of this article, we will share some tips on using Wireshark in packet analysis:
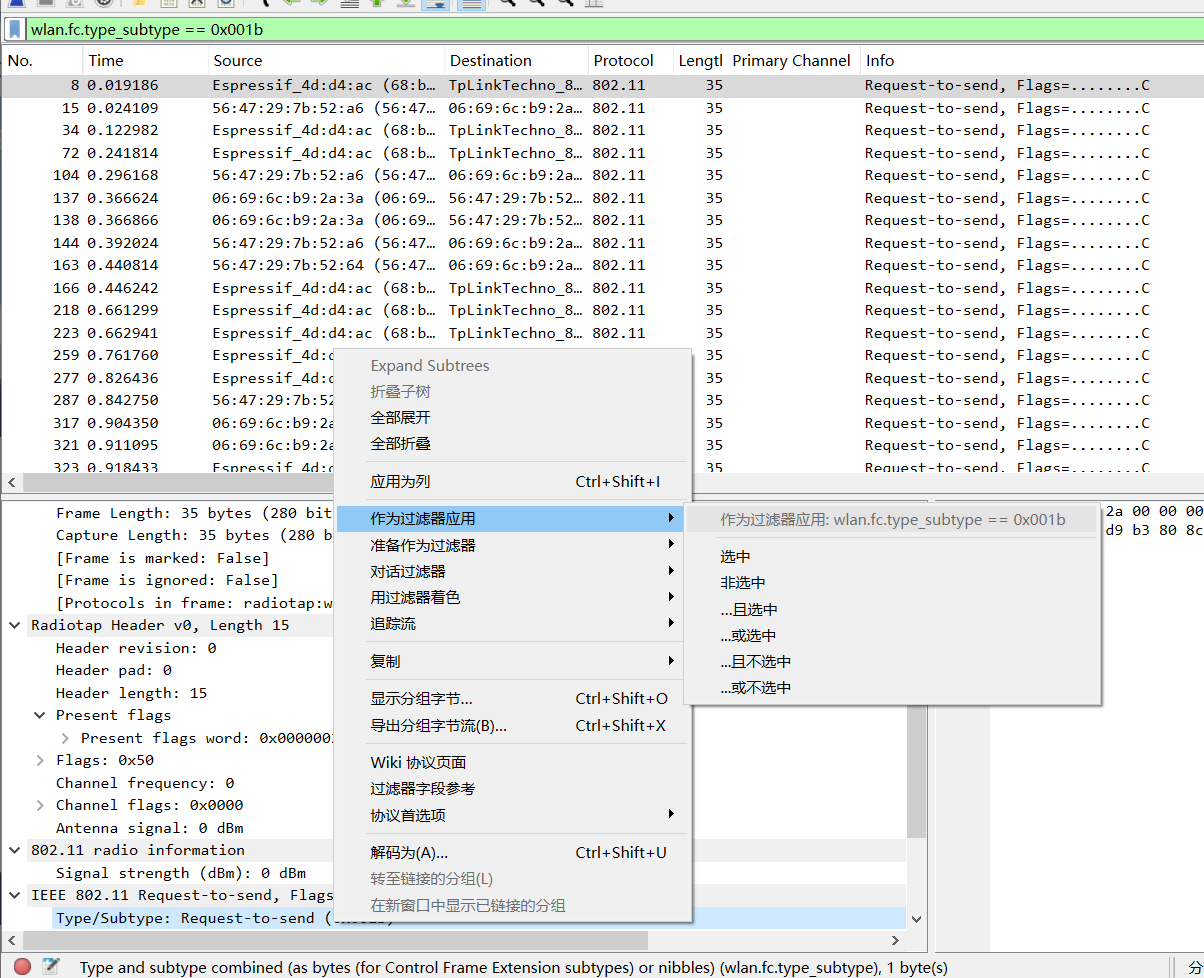
Tip 1
In addition to manually entering display filter expressions in the input box, you can also select an option from the packet capture data, right-click and choose Apply as Filter, then select Selected, Not Selected, or the more advanced and or logical operations according to your needs. The following figure filters the RTS packets with subtype as 0x001b, which is equivalent to entering wlan.fc.type_subtype == 0x001b in the display filter bar.
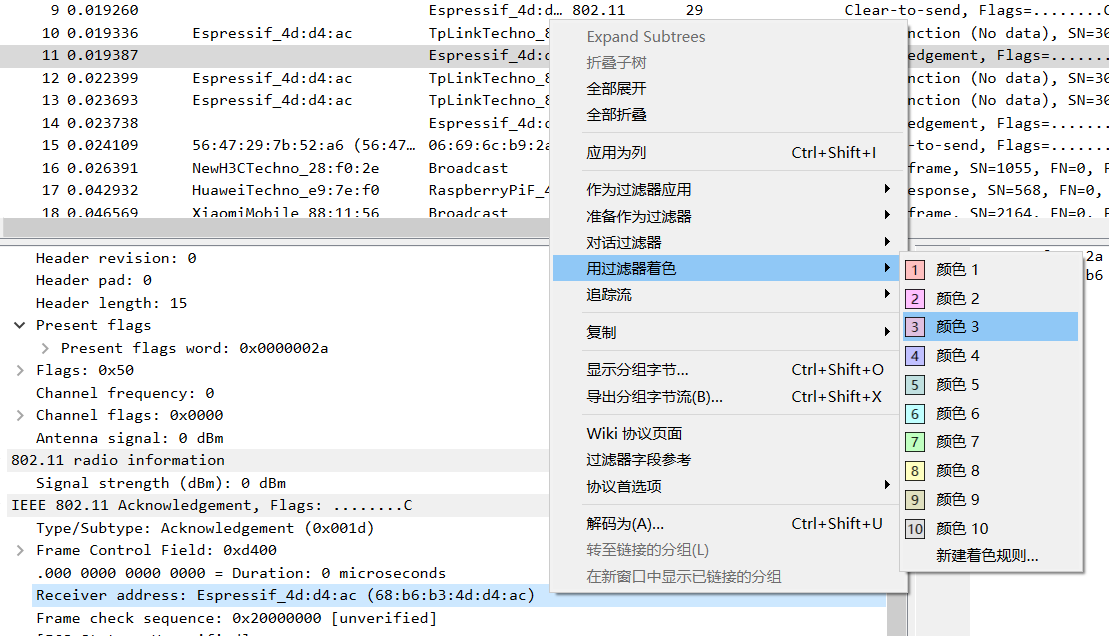
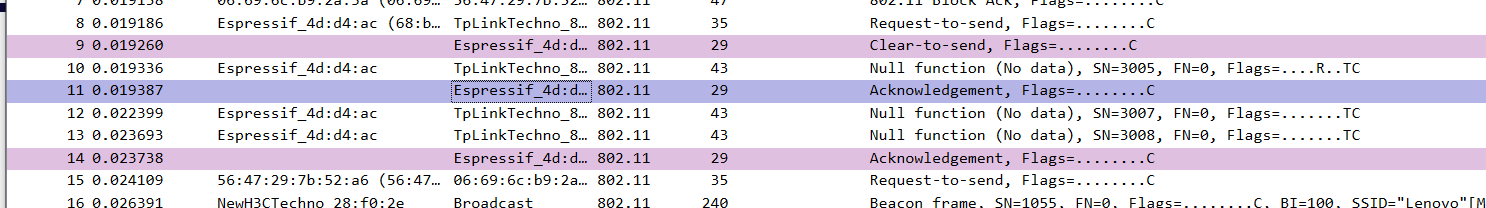
Tip 2
Use shaders to assist in analyzing various packets. Select an option from the packet capture data, right-click and choose Apply as Filter with Coloring to color packets that meet specific conditions. The following figure colors packets with a Receiver address of Espressif_4d:d4:ac (68:b6:b3:4d:d4:ac) as color 3:
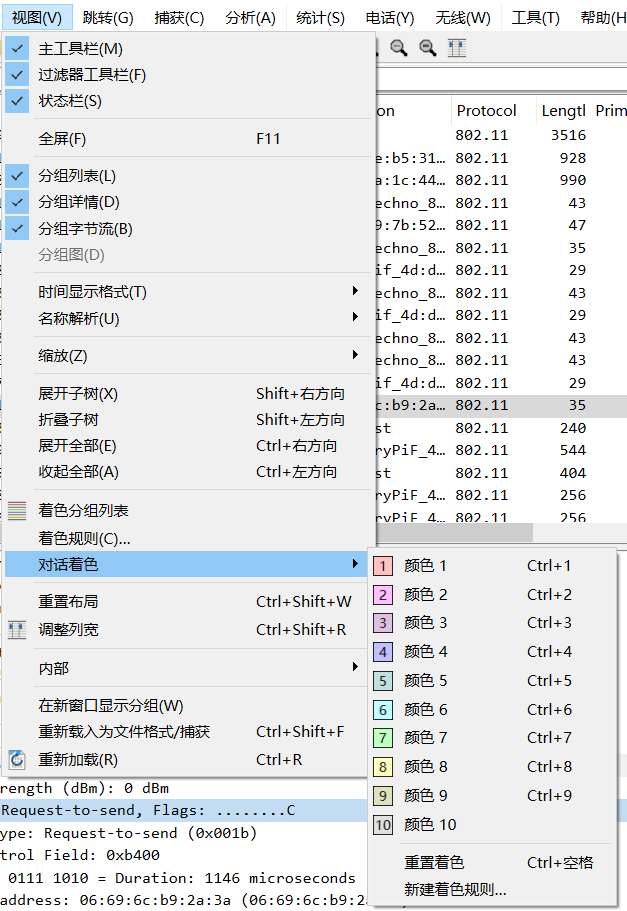
You can manage or reset existing rules in View - Conversation Coloring:
Tip 3
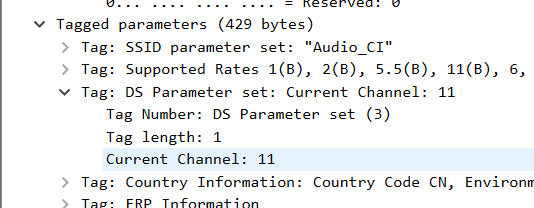
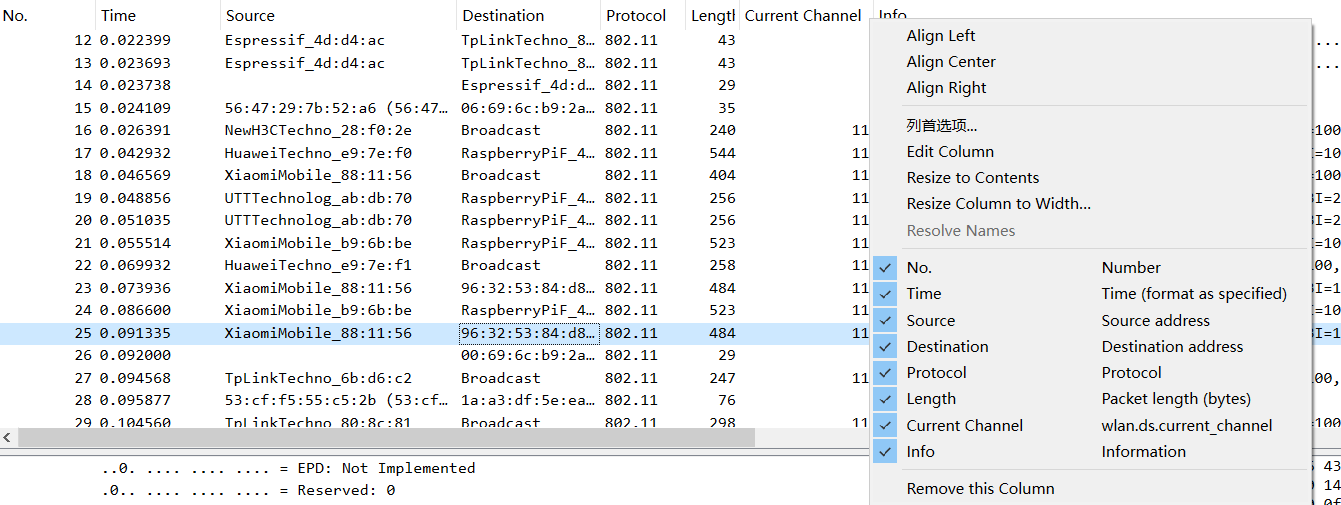
You can drag any field of interest to the list bar for display. For example, the following figure drags the current channel field to the Packet List Pane, making it easy to view the channel information for each packet:
Right-click the list bar to manage the settings rules for each column:
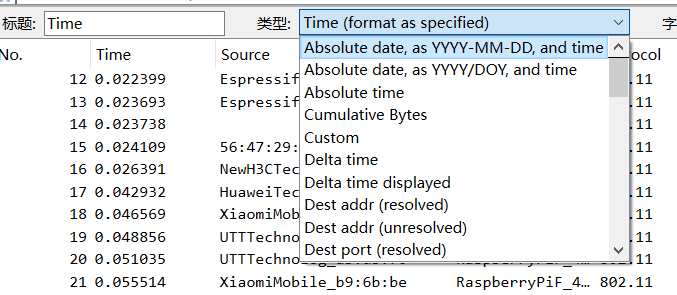
You can also choose Edit column to set:

Tip 4
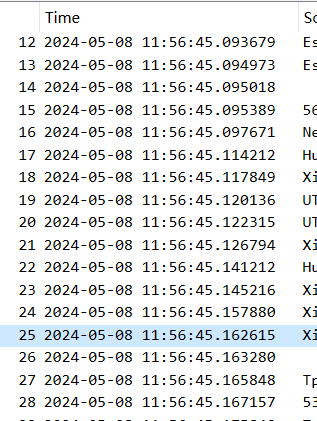
Sometimes we need to debug complex issues and capture multiple logs from different devices. Setting absolute timestamps can help locate complex issues across devices. Open the column settings bar using the method in Tip 3, select Absolute date, and you can display the absolute time for each packet:
After setting: