Collecting Document Feedback
To better gather user feedback, we can use a quicker and easier feedback channel by clicking thumbs up or down, and the number of likes and dislikes will be collected using Google Analytics.
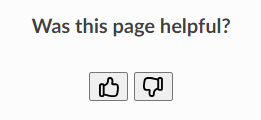
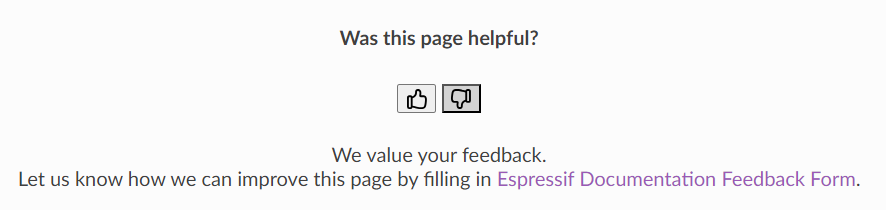
After clicking the thumbs up button:

After clicking the thumbs down button:
Note
Espressif Documentation Feedback Form is the link to the classic feedback form.
How to Add the Feedback Section to Your Repo
Currently, there is a _templates folder under both the en and zh_CN directories in the documentation repository. Each folder contains a layout.html file that stores the feedback section for this documentation repository. Replace the content of this layout.html with the corresponding language’s layout.html from the ../../feedback_templates directory.
You need to replace YOUR_DOCID in the official website links (lines 53 and 60) with the corresponding docId for the document. Please note that the docIds for English and Chinese documents are different.
After that, you can compile the documentation, then the feedback section with thumbs up and down will appear.
Configuration of Collection of User Reactions in Google Analytics
We need to add custom events to Google Analytics (GA4) to enable tracking of users feedback on documentation in the form of thumbs up/down.
Prerequisites
The site with documentation to track reactions should be added to Google Analytics, see ESP-Docs > Configuring ESP-Docs Projects » Collecting User Analytics.
The Google Analytics should collect data from the site.
The site should include the feedback section that shows thumbs up/down buttons (previous step).
To configure the collection of user reactions in Google Analytics, you need to have access to the Google Analytics account that is used for the site with documentation.
Configuration
The configuration of the collection of user reactions in Google Analytics consists of the following steps:
Check if Custom Events are Sent to Google Analytics
Open the site with documentation in a browser and click the thumbs up/down buttons on a couple of pages.
Open the Google Analytics account that is used for the site with documentation. Go to Reports > Realtime.
On the dashboard find the Event count by Event name section and check if the events user_reaction are sent to Google Analytics. You may need to wait a couple of seconds for the events to appear. See the picture below.
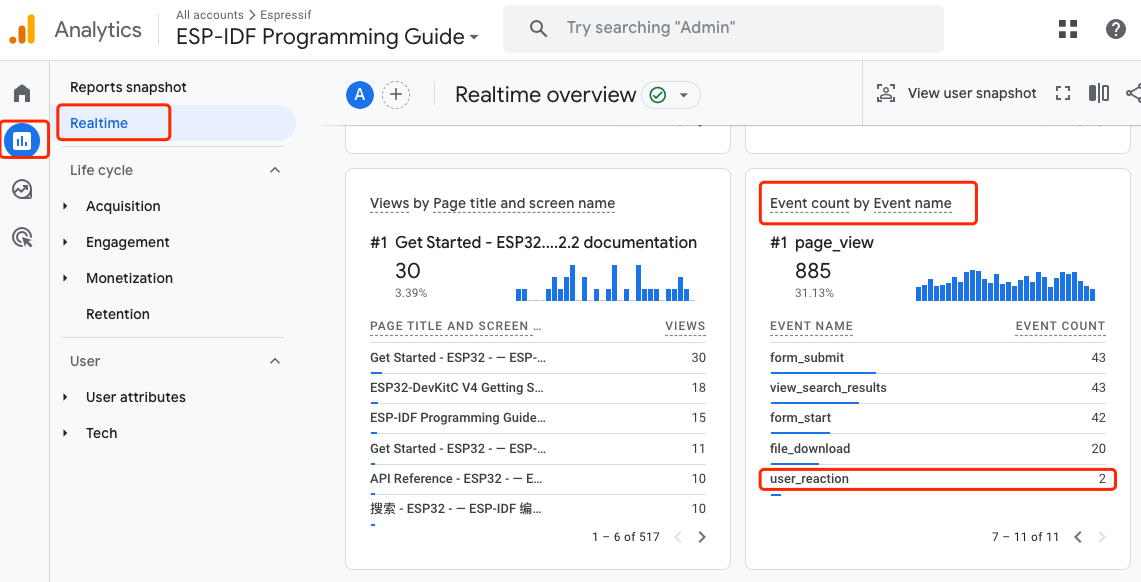
If the events are not sent to Google Analytics, check the code that sends the events to Google Analytics (previous step).
Add Custom Definition to Google Analytics
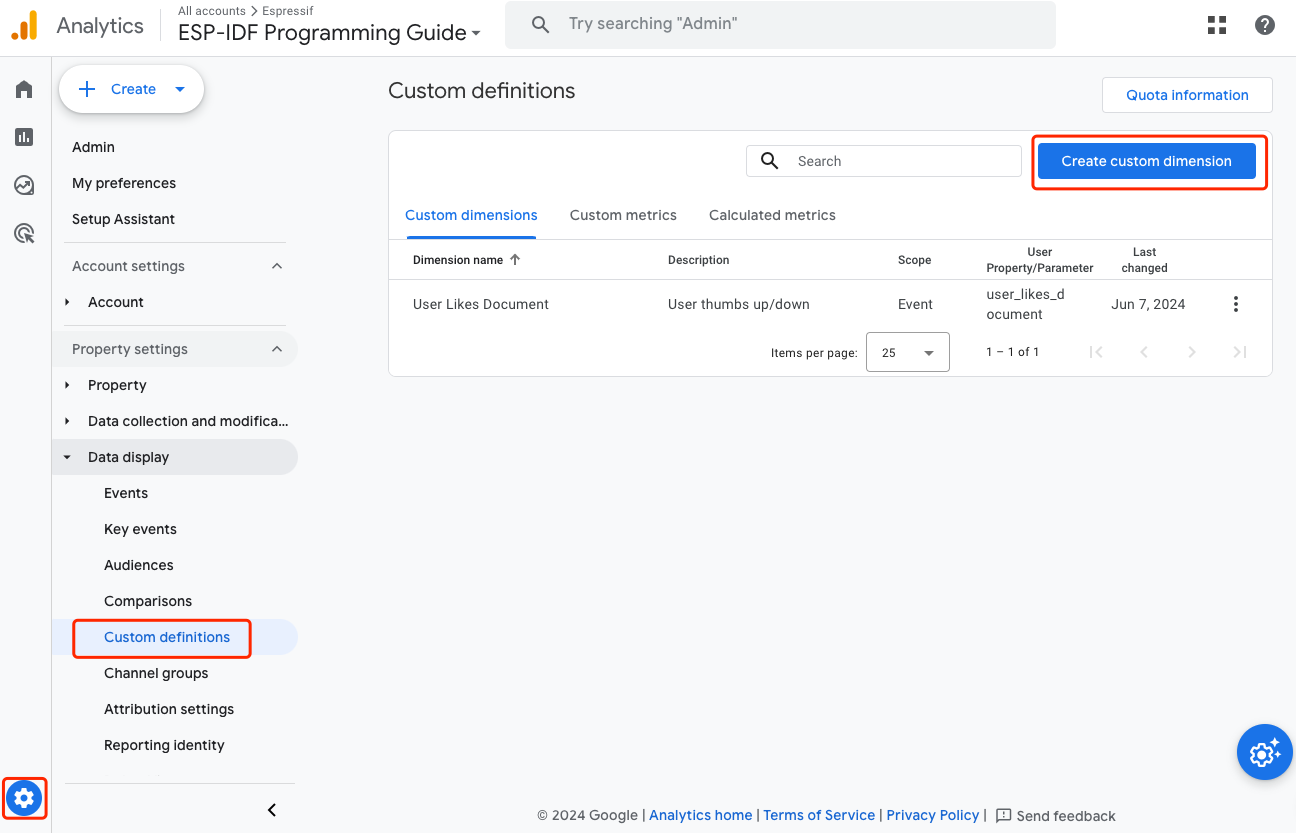
Open the Google Analytics account that is used for the site with documentation. Go to Admin > Property settings > Data display > Custom definitions.
Click Create custom dimension and configure the custom dimension as follows:
Dimension name: User Like Document
Description: User thumbs up/down reaction on documentation
Scope: Event
User Property/Parameter: user_likes_document
Click Save to save the custom dimension. See the picture below how the custom dimension should look like.
Configure Exploration Report
Go to Explore and click Create a new exploration. See the picture below.

Configure the report’s input Variables.
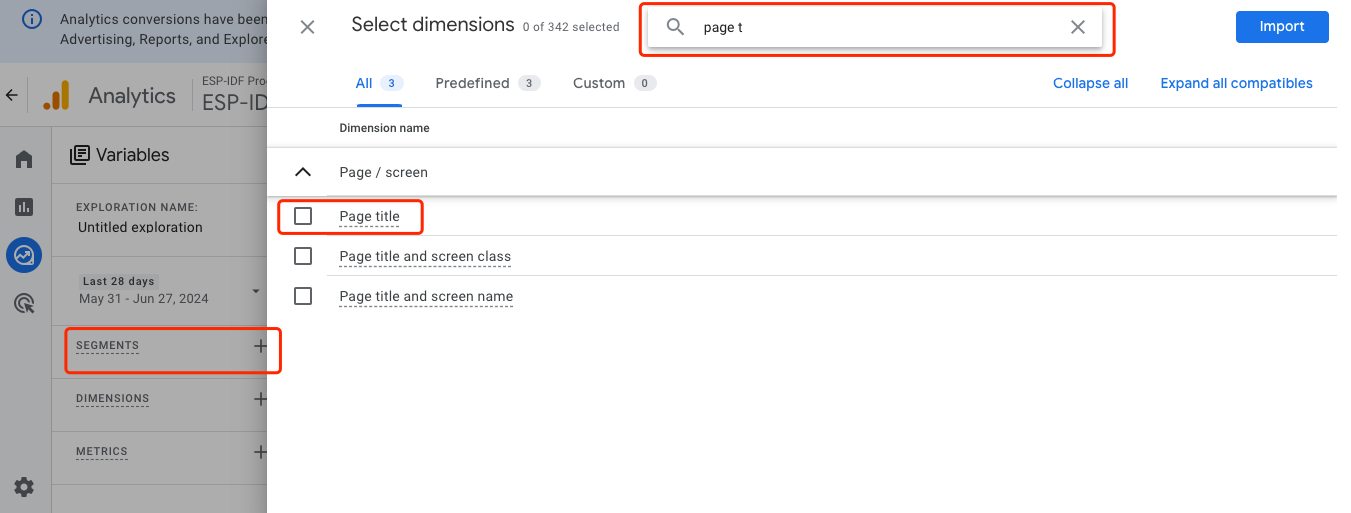
Under DIMENSIONS, click +. On the next page that will show up search and then select the following dimensions (see picture below). Click Import once both dimensions are selected.
Page Title
User Likes Document
Event Name
Under METRICS, click +. On the next page that will show up search and then select the following metric. Click Import once the metric is selected.
Event count
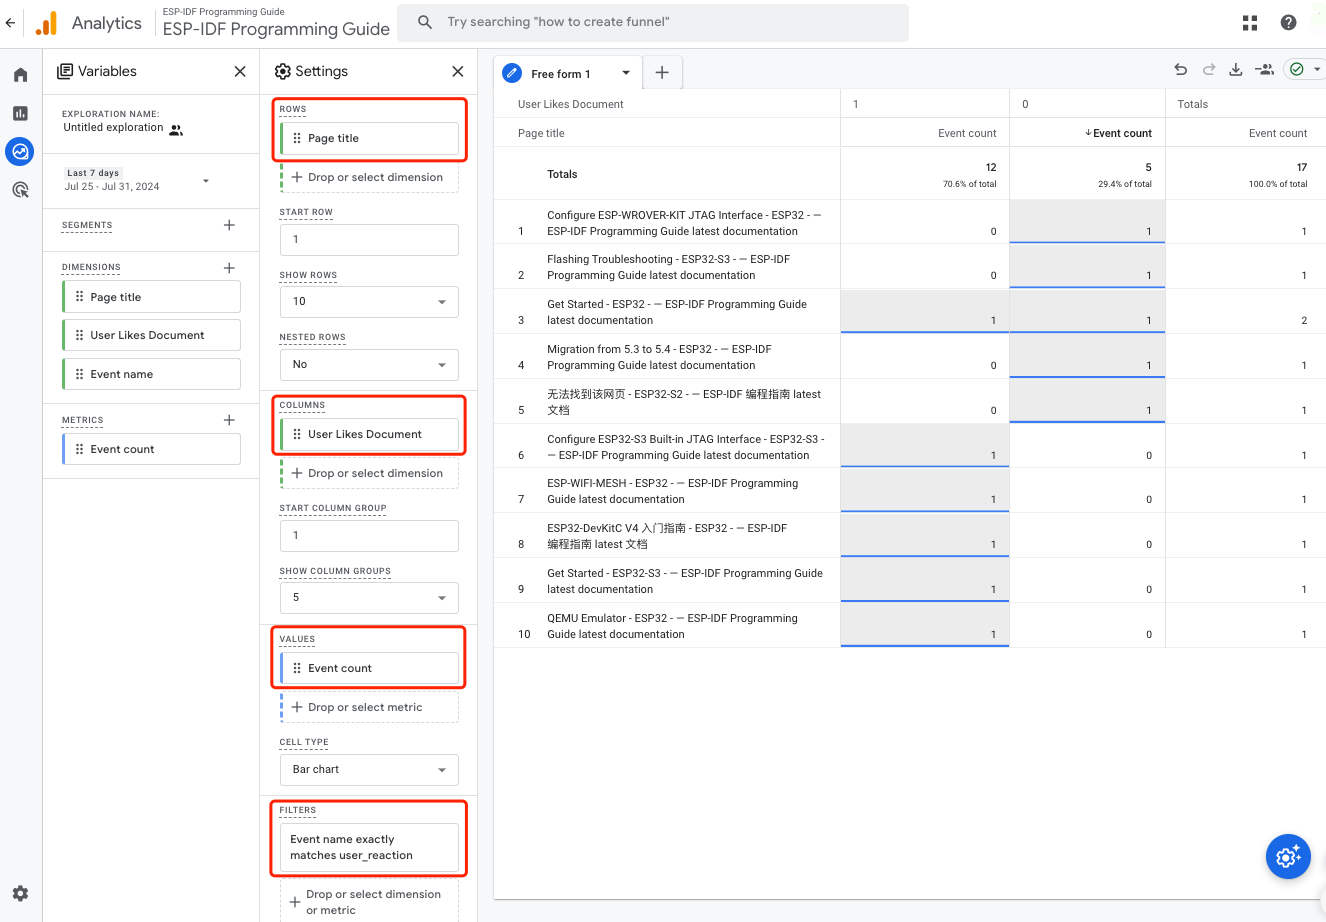
Configure report by dragging and dropping previously added dimensions and metrics to the Settings panel.
Drop Page Title dimension to the ROWS section.
Drop User Likes Document dimension to the COLUMNS section.
Drop Event count metric to the VALUES section.
Drop Event name dimension to the FILTERS section.
Set the Event name filter to exactly matches the user_reaction.
See the picture below. You may need to scroll down the Settings panel to see the FILTERS section.
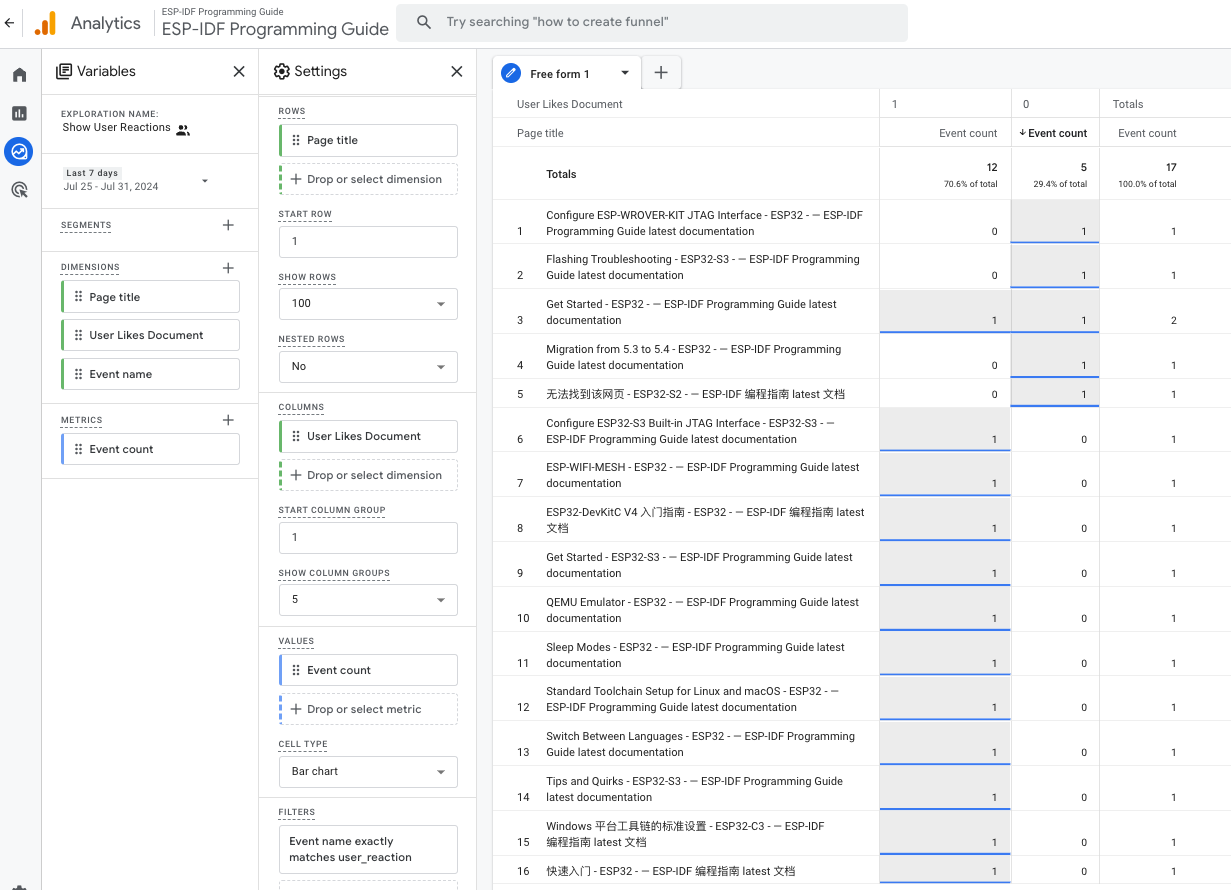
Fine tune the configuration:
Change the EXPLORATION NAME to Show User Reactions.
Select desired period to show the results.
Change SHOW ROWS to e.g. 100 to display more rows.
The report would look like the picture below.
Note
The exploration reports do not show values for the current day. You need to wait at least 24 h from the first thumbs up/down clicked to see some values.