This document will briefly introduce the common image formats used in Espressif software documentation built with ESP-Docs, describe their usage, and provide corresponding examples for writers’ reference.
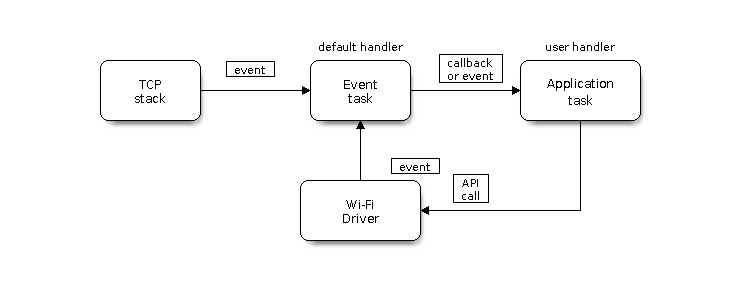
Figures serve an essential role in conveying complex technical information. If you are writing some technical text and feel like expressing your ideas is getting increasingly harder (for example, while describing logical connections), consider using a diagram. Even the most complex ideas that are hard to understand when written as text can be quickly understood with the simplest of diagrams. The key to success is to choose the right diagram type for your case.
Luckily, diagrams in Espressif software documentation built with ESP-Docs already have more or less established styles.
There are different ways of rendering images in documentation:
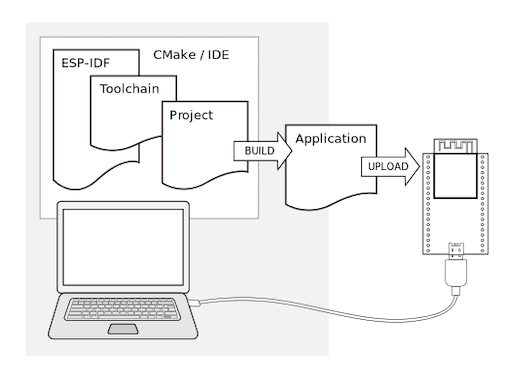
- Directives to include ready-to-use pictures created by graphic editors.
- Diagram as Code to create diagrams based on textual descriptions for documents based on markup languages.
For detailed information about how to use these directives, please refer to Section Figure in the reStructuredText documentation. Below are some notes for writers when using the directives in our documentation.
For the ..figure:: directive, the path followed can either be a URL, or a relative path to your figures in the current project. For example, to link the specific figure under the _static folder, it can be written as:
    .. figure:: ../../_static/doc-format1-recommend.png

or to access the separate server through the URL::

    .. figure:: https://dl.espressif.com/dl/sche,atocs/pictures/esp32-s2-kaluga-1-kit-v1.0-3d.png

Note that, for the relative path, if you are not sure about it, please check in the terminal using ``cd ..``. For the URL, if the figures are too large, upload it to a separate server, then provide the URL.

Generally, for each repo, figures are stored in the ``_static`` folder. Below are some of the paths for your information:

    - ESP-IDF: `esp-idf/docs/_static <https://github.com/espressif/esp-idf/tree/master/docs/_static>`_
    - ESP-ADF: `esp-adf-internal/docs/_static <https://github.com/espressif/esp-adf/tree/master/docs/_static>`_
    - ESP-AT: `esp-at/docs/_static <https://github.com/espressif/esp-at/tree/master/docs/_static>`_
    - ESP-Docs: `esp-docs/docs/_static <https://github.com/espressif/esp-docs/tree/master/docs/_static>`_
    - esp-dev-kits: `esp-dev-kits/docs/_static <https://github.com/espressif/esp-dev-kits/tree/master/docs/_static>`_

Note that if you use the ``... figure::`` directive to upload the non-editable diagrams (PNG, JPG, etc.), please remember to also upload the editable copy (SVG, ODG, etc.) with the same name as the non-editable diagrams uploaded to the internal image-storing GitLab repository corresponding to the current repository. It is also recommended to add a commented-out link to the editable copy in the figure directive for easier search. The reason why we are doing this is that while the editable copy could be too large to make the repository hard to pull, storing them in another repository could always be a fortune when the content of the document has changed and writers are able to find the original images and edit them at any time.
For the align: option, while another option, figclass:align- is sometimes used together in ESP-IDF, the priorities are listed below:
If the alignments are the same, such as :align:left and :figclass:align-left are used, then the figure will be aligned left.
If different alignments are defined, such as :align:center and :figclass:align-left are used, then the figure will be aligned center (top priority) > left > right (the lowest priority), as align: has a higher priority than figclass:align-.
Thus, it is recommended to use align: instead of figclass:align- in the documentation.
For the :width: and :scale: options, note that the text column width on RTD HTML pages is approximately 700 px, so figures should be sized accordingly to display properly. Without either option, figures are displayed at their original pixel dimensions.
:width: (recommended): specify the image width as a percentage of the available text column width (e.g., :width:70%). The height is adjusted automatically to maintain the aspect ratio. Because this percentage is always relative to the text column width — approximately 700 px in HTML and the LaTeX \textwidth in PDF — all figures are displayed at a consistent size in both HTML and PDF output, regardless of their original dimensions.
:scale: is an alternative, but it has several limitations:
Requires knowing the original dimensions: Because :scale: is relative to the original pixel dimensions of the image, you need to know the original size and calculate the right percentage manually. For example, if the original figure is 3452×1590 px, you need to calculate that :scale:20% results in 690×318 px, which fits within the 700 px page width.
Not applicable to URL images without a workaround: If a URL is provided as the figure path, an error Couldnotobtainimagesize.:scale:optionisignored. might occur. As a workaround, you need to provide the original width and height of the image explicitly:
Inconsistent sizes across figures: Because :scale: is relative to each image’s original pixel dimensions, the same percentage value produces different display sizes for images with different original sizes, which can lead to layout inconsistencies in both HTML and PDF output.
For the :alt: option, it shows the alternate description of figures. This description will be displayed when the figure is shown not properly on display. Normally, the caption of the figure would be placed here. If the figure is scaled, then the writer should also add (Click to enlarge) after the caption.
With these extensions, diagram images are generated from simple text descriptions. The diagram elements are laid out automatically. The diagram code is then typically rendered as raster images (often PNG) and integrated “behind the scenes” into Sphinx documents. Choose the one that best fits your diagram type.
Before building documentation with this extension, install the Graphviz binaries on your system. Installers for all major platforms are available at https://graphviz.org/download/.
..graphviz:::caption:ESP-IDFDevelopmentWorkflow:align:centerdigraphesp_idf_develop{graph[rankdir=TBfontname="Helvetica"fontsize=13splines=orthonodesep=0.5ranksep=0.6pad=0.4]node[fontname="Helvetica"fontsize=11style="filled"fillcolor="white"color="#333333"shape=boxmargin="0.2,0.12"]edge[fontname="Helvetica"fontsize=10arrowsize=0.8color="#333333"]start_project[label="Start a project\nCreate or copy an example"style="filled,dashed"]connect_device[label="Connect your device"]configure[label="Configure project"]build[label="Build project\nCompile firmware"]flash[label="Flash onto device"]monitor[label="Monitor output"shape=oval]start_project->connect_device->configure->build->flash->monitor}
For diagrams with lengthy DOT source, save the code in a .dot file and reference it
by path:
To conclude, while ready-to-use images drawn in graphic editors might be easier to handle for writers with little experience in creating diagrams, they have rather larger size based on their resolution. As for text-based Diagram as Code graphics, it would undoubtedly cost writers some time to get started and master, but they are smaller in size and easier to version with Git. Thus, it is recommended to use Diagram as Code to present pictures in your files.
![digraph esp_idf_develop {
graph [rankdir=TB fontname="Helvetica" fontsize=13
splines=ortho nodesep=0.5 ranksep=0.6 pad=0.4]
node [fontname="Helvetica" fontsize=11 style="filled"
fillcolor="white" color="#333333" shape=box margin="0.2,0.12"]
edge [fontname="Helvetica" fontsize=10 arrowsize=0.8 color="#333333"]
start_project [label="Start a project\nCreate or copy an example" style="filled,dashed"]
connect_device [label="Connect your device"]
configure [label="Configure project"]
build [label="Build project\nCompile firmware"]
flash [label="Flash onto device"]
monitor [label="Monitor output" shape=oval]
start_project -> connect_device -> configure -> build -> flash -> monitor
}](../_images/graphviz-0554db80af06918e152b273e8e7d418d9fc662ad.png)