Mdebug
Mdebug (Mesh Network debug) is an important debugging solution used in ESP-MDF. It is designed to efficiently obtain ESP-MDF device logs through wireless espnow protocol, TCP protocol, serial port, etc., so that it can be read more conveniently and quickly. Then the device log information can be analyzed according to the extracted logs.
The Mdebug guide is divided into the following forms:
Introduction
The traditional debugging method is to read all the log information by connecting the serial port. Some of the log information is unnecessary information, which wastes a lot of filtering time of the user, and needs to be connected online through the PC and the device to collect log information, resulting in the log information. A waste of time and resources.
The difference between the Mdebug debugging method and the traditional debugging method is that, while not affecting the operation of the normal device, the Mdebug debugging can filter the log through wireless debugging, log storage, and control commands, thereby improving the efficiency and convenience of the log. Save time and resources for devices to find problems and read the information they need.
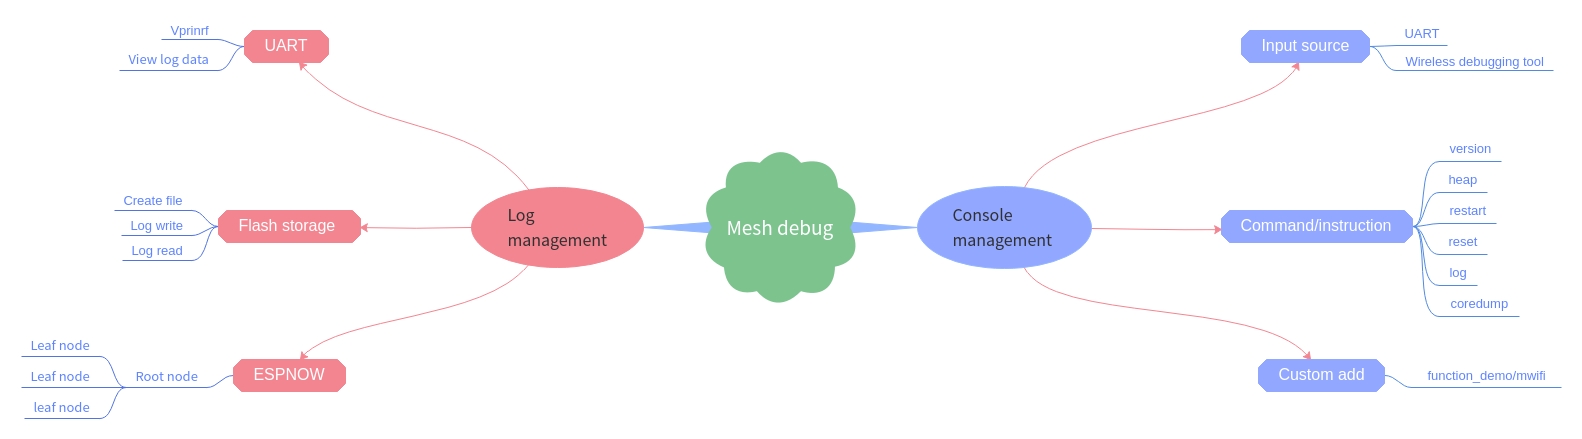
- Mdebug is mainly divided into command management and log management
- Command management can be roughly divided into input source, command/instruction, user-defined add;
- Log management can be roughly divided into UART, Flash storage, ESPNOW.
Functions
Mdebug espnow: Transfer log data from the device to other devices or servers viaESPNOWwireless WiFi form, thus improving the speed and convenience of debugging.Mdebug flash: The log data in the device is directly written into the flash memory. The memory space has been created in the flash memory. Power loss protection log information, and the log information can be read at any time, thereby improving the availability of data and the convenience of the customer.Mdebug log: The log data in the device is read out through the serial port monitor, and the log information such as MDF_LOGI, MDF_LOGD, MDF_LOGW, MDF_LOGE in ESP_MDF is read out.Mdebug console: The log data in the device is read through the input command line in the terminal, which improves the operability and practicability of the user.
Debug Method
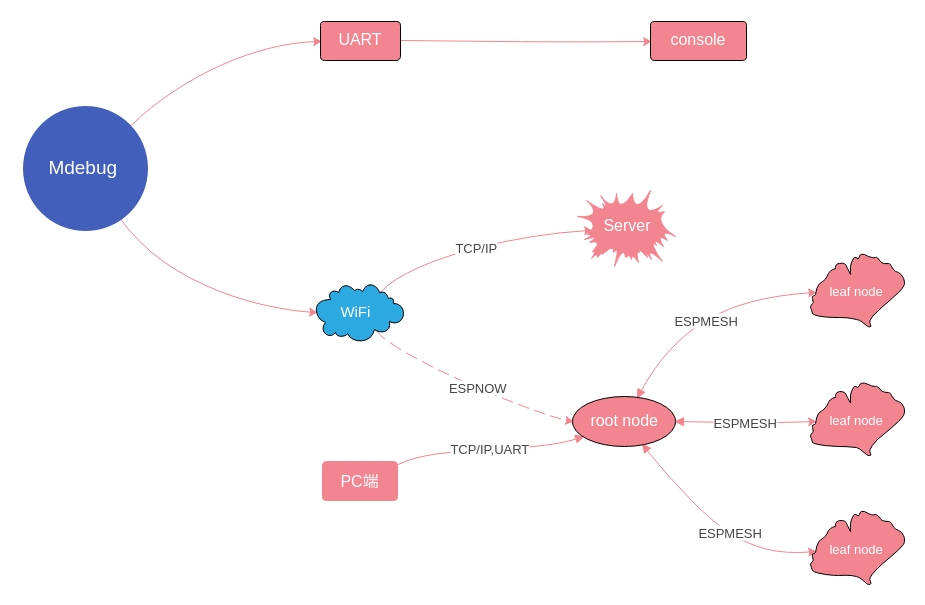
The debugging method can be summarized as two methods.One is UART serial port debugging, and the other is wireless WiFi debugging.
- Serial port debugging uses the serial port debugging tool on the PC port (use minicom under linux), directly obtains the output log information, and can output the required log information by controlling the command line debugging method.
- The wireless WiFi debugging has two communication modes: TCP/IP protocol and ESPNOW protocol. One is that the log information is transmitted to the Sever end through the TCP/IP protocol, and the other is that the log information from the child node is transmitted to the root through the ESPNOW protocol. The node then extracts log information from the serial port of the root node or TCP/IP.
Command Management
1. Input source
- serial
- PC monitor
- ESPNOW
- Wireless debugging tool (ESP-WROVER-KIT-V2)
2. Command and operation
2.1 General instruction
- help
- Print registered commands and their descriptions
- version
- Get the chip and SDK version
- heap
- Get the current available heap memory size
- restart
- Soft restart chip
- reset
- Clear all configuration information of the device
2.2 Log command
Command definition log -or [<tag>] [<level>] [-s <addr(xx:xx:xx:xx:xx:xx)>] [-e <enable_type (‘uart’or’flash’or’espnow’)>] [-d <disable_type(‘uart’or’flash’or’espnow’)>] Instruction log -o Get the log enable status log -r Read the log information log -s Send logs to the specified device Parameter tag Use tag to filter logs level Use level to filter logs addr Monitoring device MAC address e ‘uart’ or ‘flash’ or ‘espnow’ Enable serial port, flash, espnow d ‘uart’ or ‘flash’ or ‘espnow’ Disable serial port, flash, espnow Examples log mdebug_cmd INFO Set the log output level of TAG to mwifi to INFO log * NONE Set all logs to not output 2.3 Coredump command
Command definition coredump [-loe] [-q ] [-s <addr (xx:xx:xx:xx:xx:xx)>] Instruction coredump -l Get the length of the coredump data on the device coredump -o Read the coredump data on the device and print it to the console coredump -e Erase the coredump data on the device coredump -s Send coredump data from the device to the specified device Parameter addr Monitoring device MAC address sequence The serial number of the coredump data Examples coredump -s 30:ae:a4:00:4b:90 Send coredump data to 30:ae:a4:00:4b:90 device coredump -q 110 -s 30:ae:a4:00:4b:90 Send the coredump data starting with sequence number 110 to the 30:ae:a4:80:16:3c device
3. Custom add
Users can see how to customize the addition according to example:function_demo/mwifi/console_test in ESP-MDF. Add the features you want to suit your needs.
Log Management
Mdebug can be roughly divided into two forms according to the way the log is written:
- The log information of the device is printed directly from the serial port by printing or the log information is stored, and then the read is called. The storage of the log information first writes the device log to the flash memory (here, a partition is allocated as storage in the flash memory, in order to store the device log, but the allocated memory here is limited, according to the file size set by the user. The decision) will be temporarily stored in the form of a file, and then the data will be sent to the PC or the server in the form of a packet through a serial port or wirelessly;
- The device will send log information in the form of espnow. The child node log information is sent to the root node through the ESP-MESH network, and the log information is read from the device of the root node.
According to the log reading mode, there are three enabled states in the log, namely uart, flash, and espnow.
1. UART enable
The serial port is enabled and the log information will be printed out via vprintf.
- The I/O port for reading the log is UART0. The pin of the serial port is TXD0, which is GPIO1, RXD0 is GPIO3, and it is also the download serial port.
UART0 TXDO RXD0 GPIO1 GPIO3 Read the log information, diagnose the problem and find the problem. If the device is running normally, you can disable the serial port. If you do not close the serial port, it will occupy the memory. At the same time, the serial port prints too much information and activates. The watchdog makes the normal device run the program
Backtrace.The default state of the serial port is enabled. You can turn it off according to your needs.
2. Flash enable
Write flash enable to store log information in flash.
2.1 Save the log to the flash
The certain memory space selected in the partition table is
storage, and the memory allocated here provides memory space for writing the log to the flash. The file name isspiffs,spiffs partition:
# Name,   Type, SubType,  Offset,   Size,  Flags
nvs,      data, nvs,      0x9000,   16k
otadata,  data, ota,      0xd000,   8k
phy_init, data, phy,      0xf000,   4k
ota_0,    app,  ota_0,    0x10000,  1920k
ota_1,    app,  ota_1,    ,         1920k
coredump, data, coredump, ,         64K
storage,  data, spiffs,   ,         64K
reserved, data, 0xfe,     ,         64K
Note
- Before updating the partition table, you need to erase the entire flash at first;
- The partition table cannot be modified by OTA;
- The size of the file space can be allocated according to the user’s reasonable choice.
2.2 Log information access
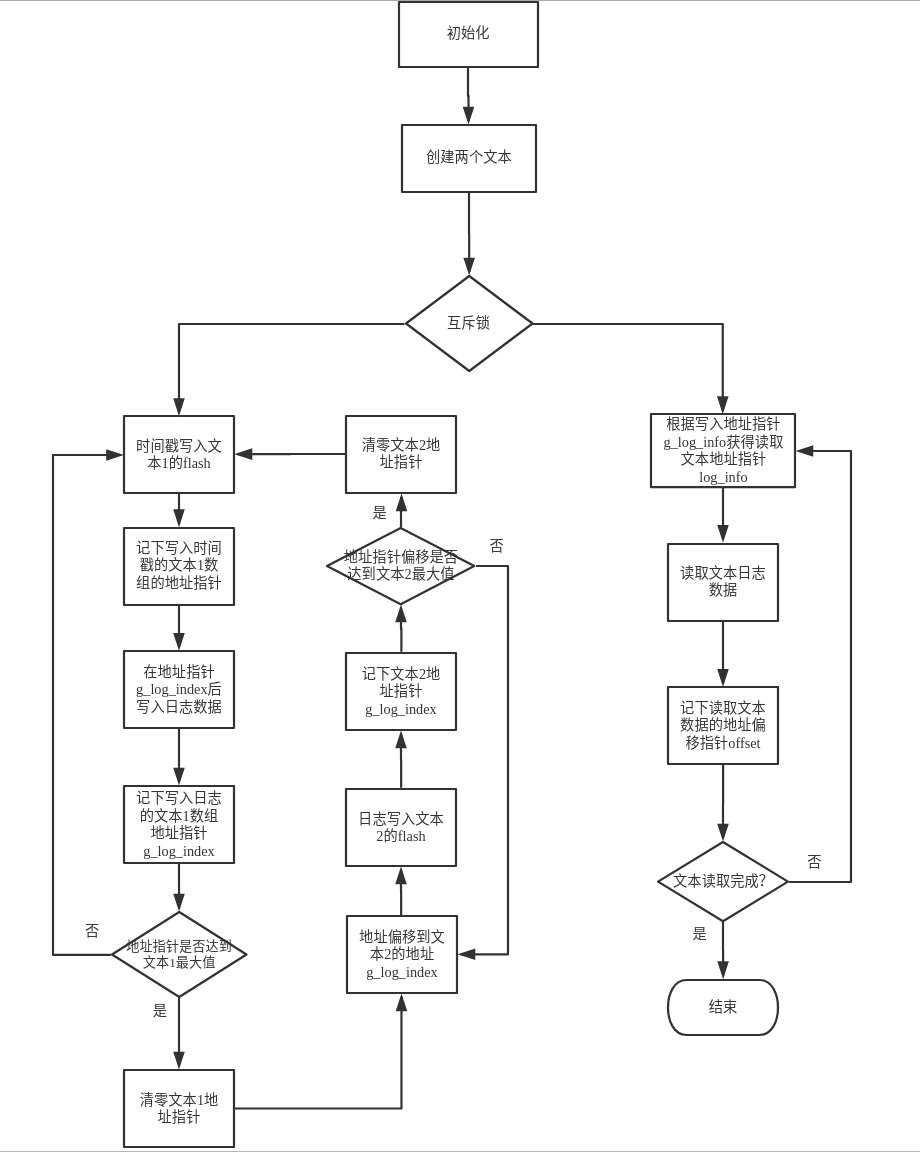
- Log initialization, create two text flash memory space, and get the state of the text
stat, determine whether to write or read, use the main function isesp_vfs_spiffs_register,esp_spiffs_info,Sprintf,fopen;- Add a mutex to the access. When the log information is read, the write function will be disabled. The main functions used are
xSemaphoreTake,xSemaphoreGive;- Write to flash, first write the timestamp, and write down the address pointer g_log_info[g_log_index] of the text array. The main functions used are
time,localtime_r,strftime;- Write the log data, and write down the address pointer
g_log_indexof the array of text 1 to write the address for the next log write flash. The main functions arefseek,fwrite;- Judge, if the address pointer of the text 1 array is full, clear the address pointer of text 1, the address is offset to the address pointer of text 2, and start writing log data; if it is not full, it will continue to write in text 1. Log data
- Similarly, when the address pointer of the text 2 array is full, the address pointer of the text 2 is cleared, the address is offset to the address pointer of the text 1, and the log data is started to be written; if it is not full, it will continue in the text 2 Write log data;
- Obtain the read text address pointer log_info according to the write address pointer g_log_info, then read the log data in the text, and also write down the address offset pointer offset of the read text data, for the next time from flash Read the log for address addressing, using the main functions as
fseek,fread;- Judge that if the text is not read, the text log data will continue to be read; if the text is read, the read task will end.
Note
- The header of the log data is added with a timestamp. It is only used as an experiment, and there is no real-time calibration. The user can modify it according to his own needs.
- The file size of the log storage is CONFIG_MDEBUG_FLASH_FILE_MAX_SIZE = 16384. You can modify the storage space of the log file according to your needs.
Log RedirectionThe log storage information output is re-defined. This is to debug the log write flash. When the log output information has a problem, the log output information can be better debugged. The debugging function isMDEBUG_PRINTF(fmt, ...);- Added data erasure. When the data is full, the data pointer will be cleared, and the main function
rewindused will be restarted from the file header pointer address.2.3 Log data format
The log data will come from MDF_LOGI, MDF_LOGD, MDF_LOGW, MDF_LOGE, etc. in ESP_MDF. This is because the IDF’s log library will use the function of class vprintf to output the formatted string to the dedicated UART by default. The extracted data is shown below:
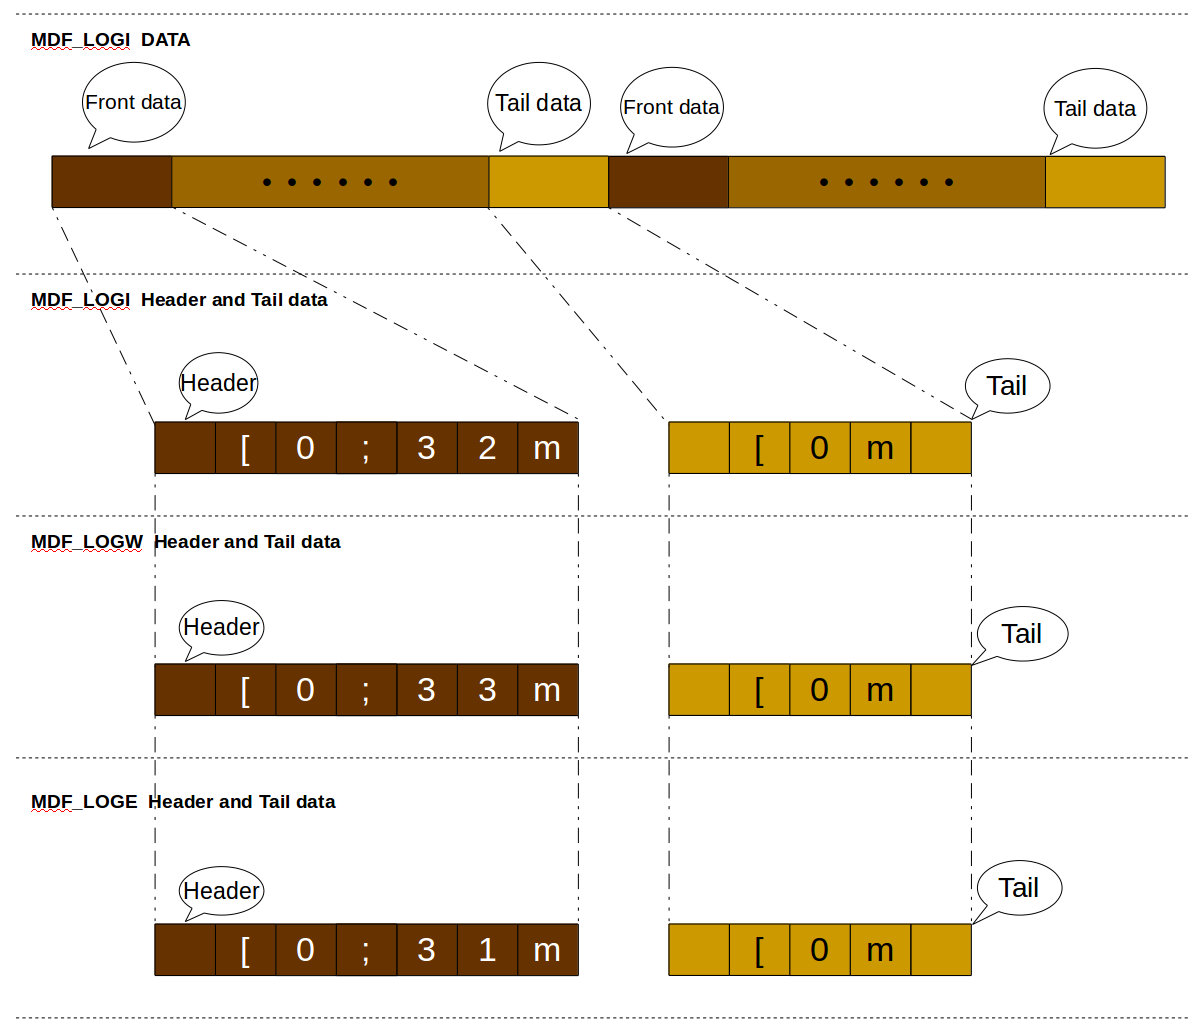
Since the log information in the MDF has unnecessary data at the beginning and the end, it is necessary to extract and select valid string data information, so it needs to be removed and filtered, and then the log data is extracted.
Front datacontains the added information such as the font color, so the header part data needs to be removed, andTail datacontains the data such as line breaks, which also needs to be removed. There is no such useless data for MDF_LOGD, so no processing is required.
3. ESPNOW enable
3.1 ESP-NOW Features
- Both sender and receiver must be on the same channel
- The receiving end may not add the MAC address of the sender in the case of non-encrypted communication (addition required for encrypted communication), but the sender must add the MAC address of the receiver.
- ESP-NOW can add up to 20 paired devices and support up to 6 devices for communication encryption
- Receive packets by registering a callback function, and check the delivery (success or failure)
- Secure data with CTR and CBC-MAC protocol (CCMP)
3.2 ESP-NOW enable process
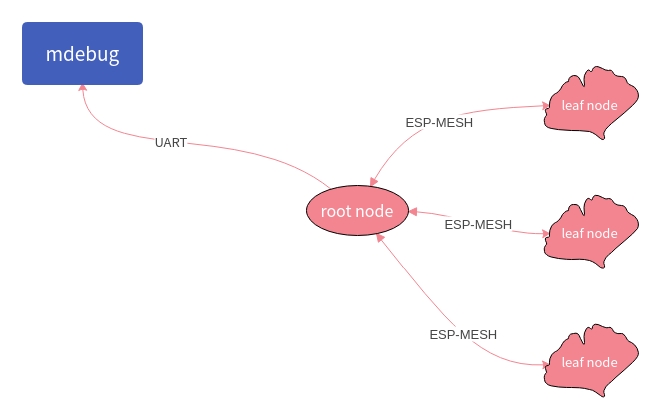
By enabling espnow, the log data of the child node can be sent to the root node through espnow, so that the log information of the child node is read from the root node, and then the log information is read through the serial port. For more on espnow see example:wireless_debug.
MDF_ERROR_ASSERT(mdebug_console_init());
MDF_ERROR_ASSERT(mdebug_espnow_init());
mdebug_cmd_register_common();
For more espnow see example:wireless_debug and the official documentation espnow.
Note
Because ESP-NOW is the same as ESP-MESH, it sends and receives data packets through the Wi-Fi interface. Therefore, when the ESP-MESH device has a large amount of data transmission, it will generate some delay for its control command reception or data transmission. After actual testing, the ESP-MESH device delay caused by the following configuration parameters is a negligible threshold when the network environment is good:
- 50 ESP-MESH devices (the more the number of devices, the worse the network environment)
- Add 10 ESP-MESH devices to the ESP-NOW receiving end (the more the receiving end is added, the worse the network environment)
- The transfer log level is info (the lower the log level, the worse the network environment)