Debugging Examples
This section describes debugging with GDB from Eclipse as well as from Command Line.
Eclipse
Verify if your target is ready and loaded with get-started/blink example. Configure and start debugger following steps in section Eclipse. Pick up where target was left by debugger, i.e. having the application halted at breakpoint established at app_main().
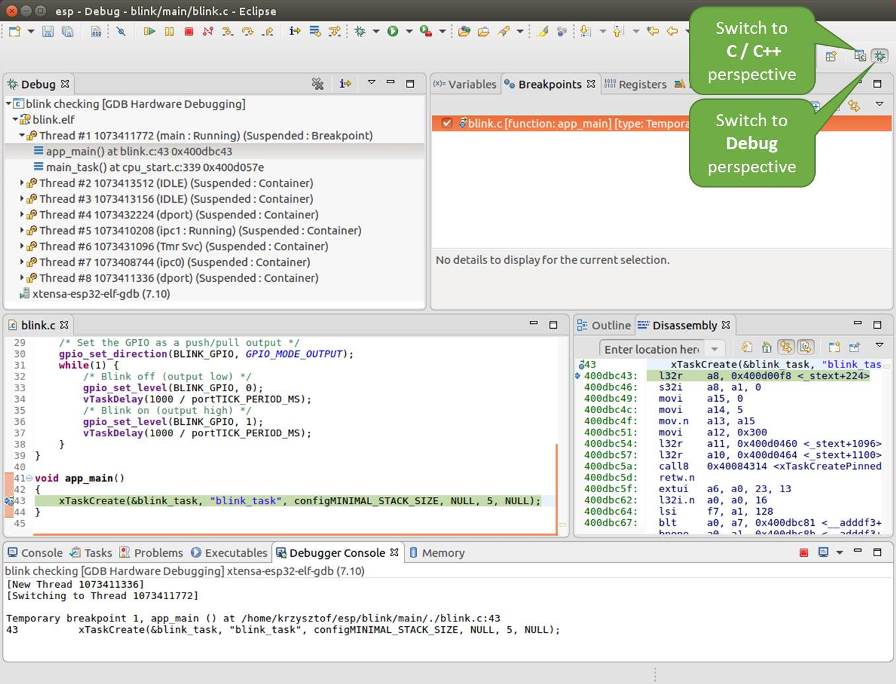
Debug Perspective in Eclipse
Examples in this section
Navigating through the code, call stack and threads
When the target is halted, debugger shows the list of threads in “Debug” window. The line of code where program halted is highlighted in another window below, as shown on the following picture. The LED stops blinking.
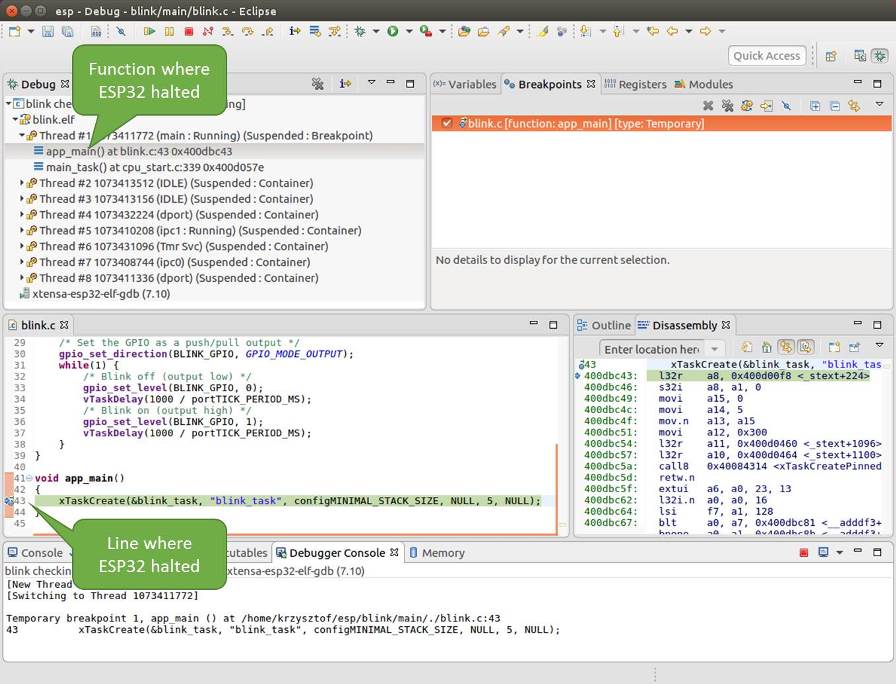
Target halted during debugging
Specific thread where the program halted is expanded showing the call stack. It represents function calls that lead up to the highlighted line of code, where the target halted. The first line of call stack under Thread #1 contains the last called function app_main(), that in turn was called from function main_task() shown in a line below. Each line of the stack also contains the file name and line number where the function was called. By clicking / highlighting the stack entries, in window below, you will see contents of this file.
By expanding threads you can navigate throughout the application. Expand Thread #5 that contains much longer call stack. You will see there, besides function calls, numbers like 0x4000000c. They represent addresses of binary code not provided in source form.
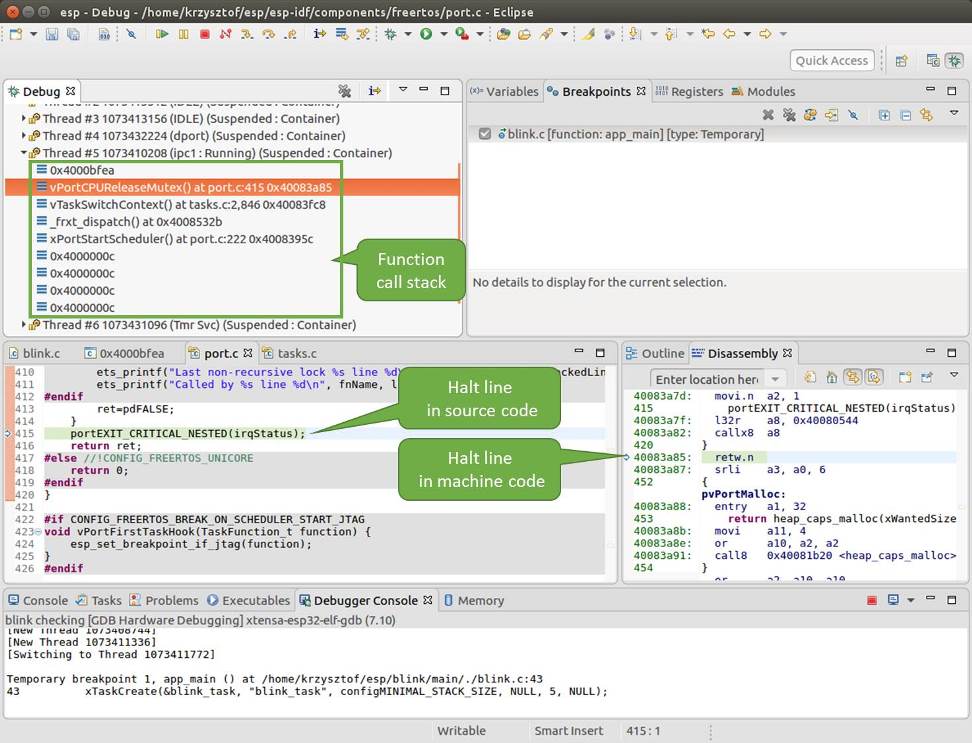
Navigate through the call stack
In another window on right, you can see the disassembled machine code no matter if your project provides it in source or only the binary form.
Go back to the app_main() in Thread #1 to familiar code of blink.c file that will be examined in more details in the following examples. Debugger makes it easy to navigate through the code of entire application. This comes handy when stepping through the code and working with breakpoints and will be discussed below.
Setting and clearing breakpoints
When debugging, we would like to be able to stop the application at critical lines of code and then examine the state of specific variables, memory and registers / peripherals. To do so we are using breakpoints. They provide a convenient way to quickly get to and halt the application at specific line.
Let’s establish two breakpoints when the state of LED changes. Basing on code listing above, this happens at lines 33 and 36. To do so, hold the “Control” on the keyboard and double clink on number 33 in file blink.c file. A dialog will open where you can confirm your selection by pressing “OK” button. If you do not like to see the dialog just double click the line number. Set another breakpoint in line 36.
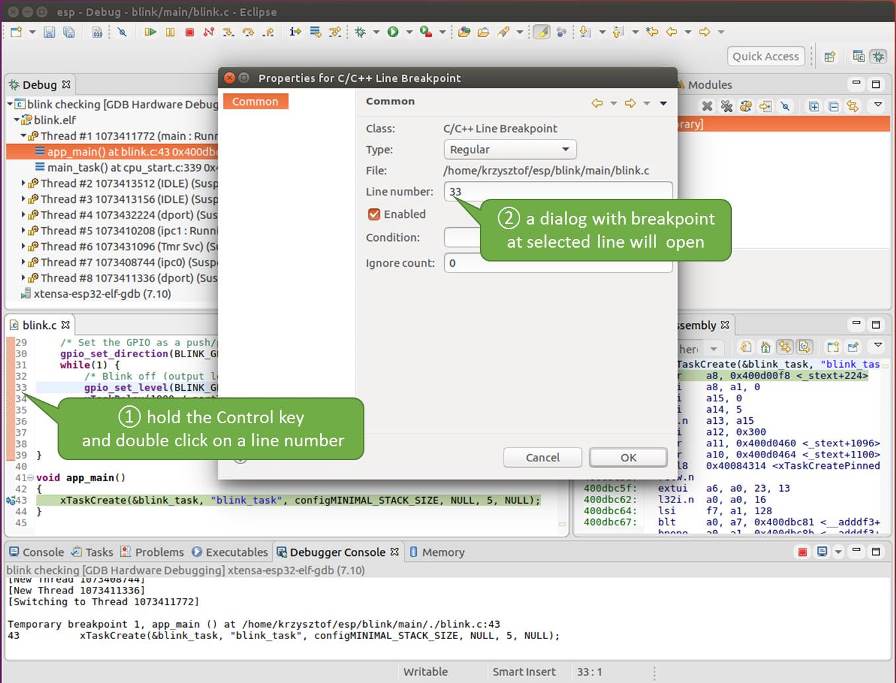
Setting a breakpoint
Information how many breakpoints are set and where is shown in window “Breakpoints” on top right. Click “Show Breakpoints Supported by Selected Target” to refresh this list. Besides the two just set breakpoints the list may contain temporary breakpoint at function app_main() established at debugger start. As maximum two breakpoints are allowed (see Breakpoints and watchpoints available), you need to delete it, or debugging will fail.
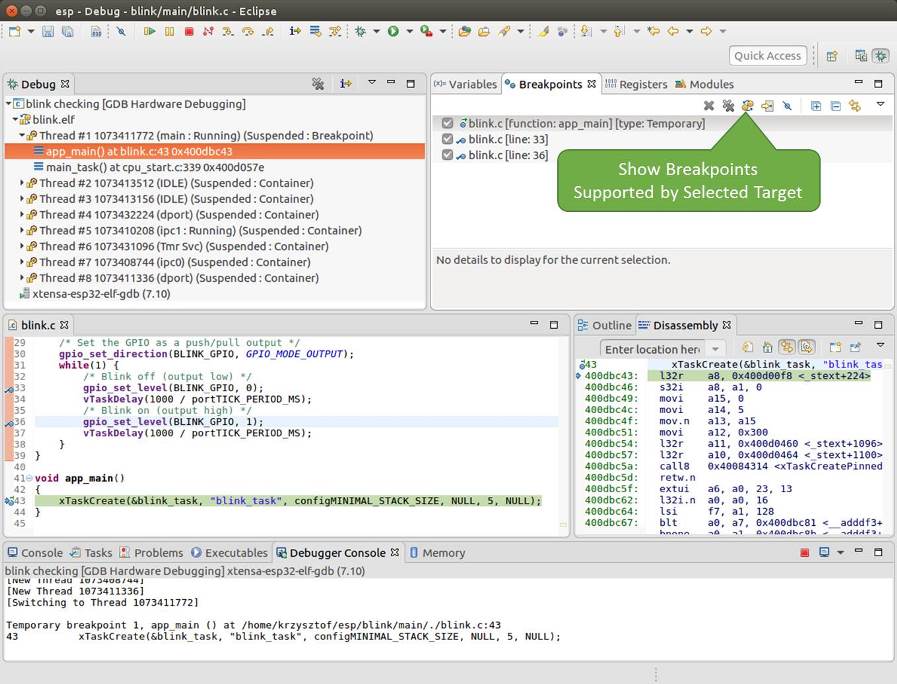
Three breakpoints are set / maximum two are allowed
If you now click “Resume” (click blink_task() under “Tread #8”, if “Resume” button is grayed out), the processor will run and halt at a breakpoint. Clicking “Resume” another time will make it run again, halt on second breakpoint, and so on.
You will be also able to see that LED is changing the state after each click to “Resume” program execution.
Read more about breakpoints under Breakpoints and watchpoints available and What else should I know about breakpoints?
Halting the target manually
When debugging, you may resume application and enter code waiting for some event or staying in infinite loop without any break points defined. In such case, to go back to debugging mode, you can break program execution manually by pressing “Suspend” button.
To check it, delete all breakpoints and click “Resume”. Then click “Suspend”. Application will be halted at some random point and LED will stop blinking. Debugger will expand tread and highlight the line of code where application halted.
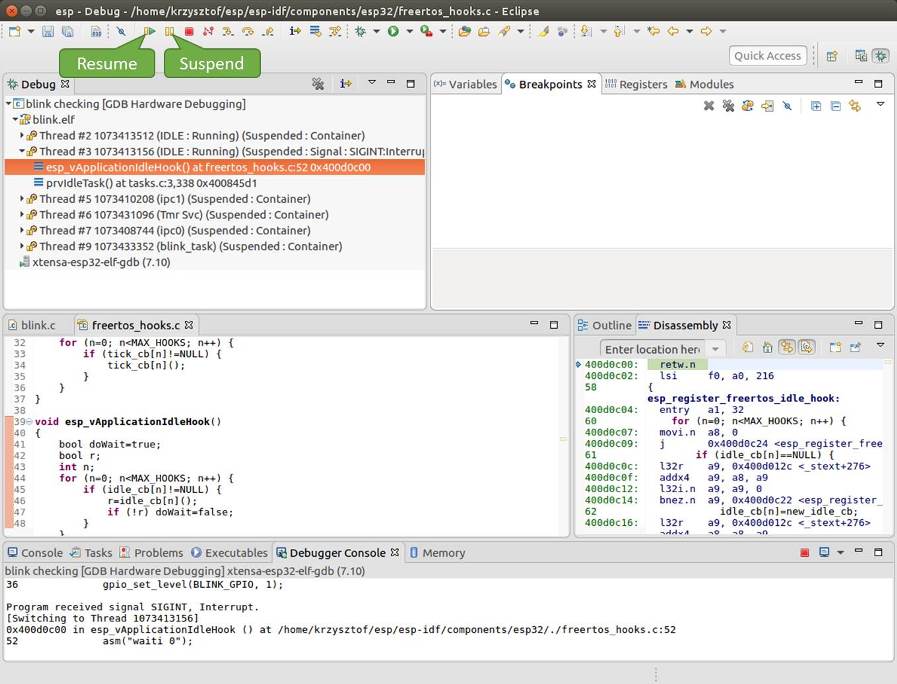
Target halted manually
In particular case above, the application has been halted in line 52 of code in file freertos_hooks.c Now you can resume it again by pressing “Resume” button or do some debugging as discussed below.
Stepping through the code
It is also possible to step through the code using “Step Into (F5)” and “Step Over (F6)” commands. The difference is that “Step Into (F5)” is entering inside subroutines calls, while “Step Over (F6)” steps over the call, treating it as a single source line.
Before being able to demonstrate this functionality, using information discussed in previous paragraph, make sure that you have only one breakpoint defined at line 36 of blink.c.
Resume program by entering pressing F8 and let it halt. Now press “Step Over (F6)”, one by one couple of times, to see how debugger is stepping one program line at a time.
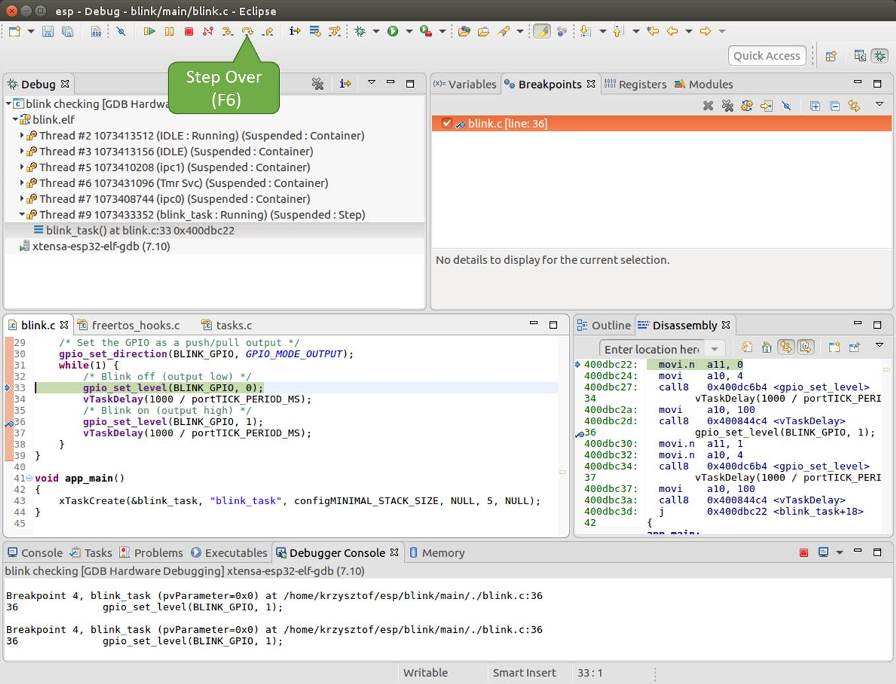
Stepping through the code with “Step Over (F6)”
If you press “Step Into (F5)” instead, then debugger will step inside subroutine calls.
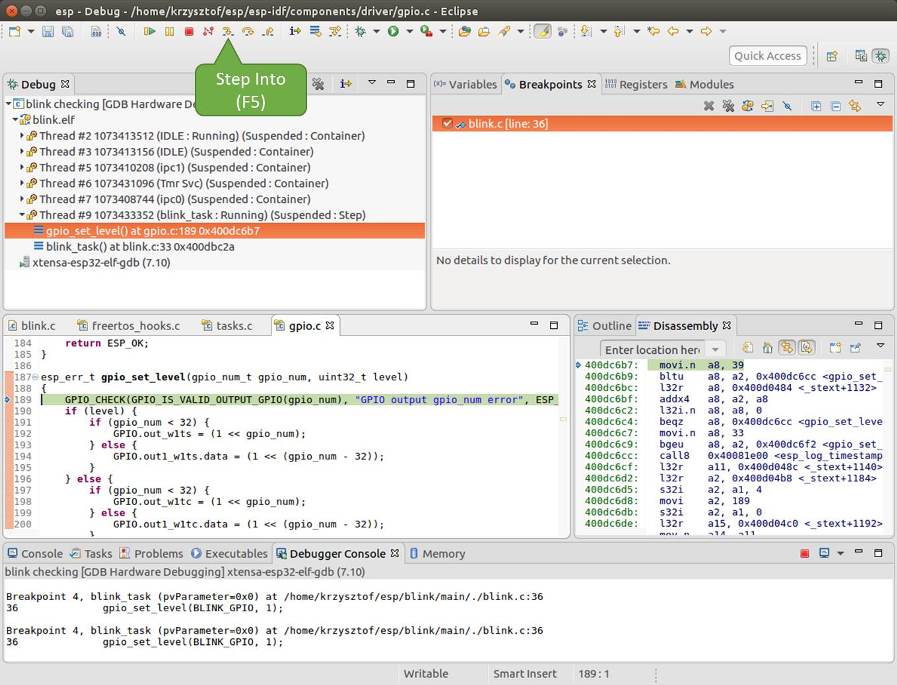
Stepping through the code with “Step Into (F5)”
In this particular case debugger stepped inside gpio_set_level(BLINK_GPIO, 0) and effectively moved to gpio.c driver code.
See Why stepping with “next” does not bypass subroutine calls? for potential limitation of using next command.
Checking and setting memory
To display or set contents of memory use “Memory” tab at the bottom of “Debug” perspective.
With the “Memory” tab, we will read from and write to the memory location 0x3FF44004 labeled as GPIO_OUT_REG used to set and clear individual GPIO’s. For more information please refer to ESP32 Technical Reference Manual, chapter IO_MUX and GPIO Matrix.
Being in the same blink.c project as before, set two breakpoints right after gpio_set_level instruction. Click “Memory” tab and then “Add Memory Monitor” button. Enter 0x3FF44004 in provided dialog.
Now resume program by pressing F8 and observe “Monitor” tab.
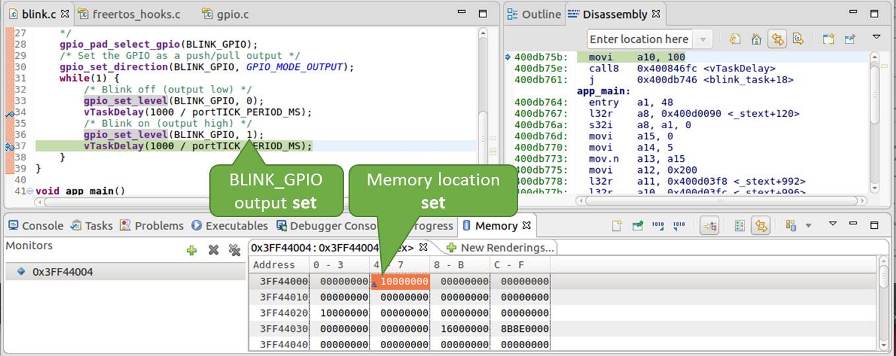
Observing memory location 0x3FF44004 changing one bit to “ON”
You should see one bit being flipped over at memory location 0x3FF44004 (and LED changing the state) each time F8 is pressed.
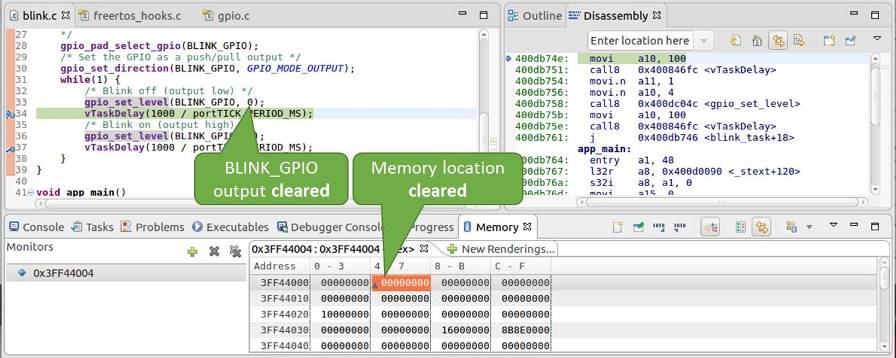
Observing memory location 0x3FF44004 changing one bit to “OFF”
To set memory use the same “Monitor” tab and the same memory location. Type in alternate bit pattern as previously observed. Immediately after pressing enter you will see LED changing the state.
Watching and setting program variables
A common debugging tasks is checking the value of a program variable as the program runs. To be able to demonstrate this functionality, update file blink.c by adding a declaration of a global variable int i above definition of function blink_task. Then add i++ inside while(1) of this function to get i incremented on each blink.
Exit debugger, so it is not confused with new code, build and flash the code to the ESP and restart debugger. There is no need to restart OpenOCD.
Once application is halted, enter a breakpoint in the line where you put i++.
In next step, in the window with “Breakpoints”, click the “Expressions” tab. If this tab is not visible, then add it by going to the top menu Window > Show View > Expressions. Then click “Add new expression” and enter i.
Resume program execution by pressing F8. Each time the program is halted you will see i value being incremented.
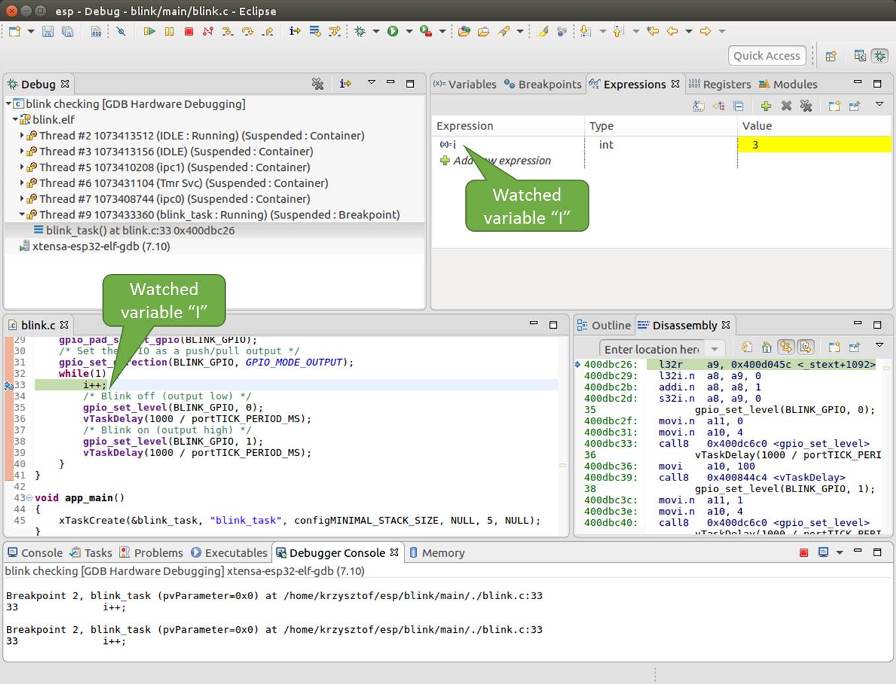
Watching program variable “i”
To modify i enter a new number in “Value” column. After pressing “Resume (F8)” the program will keep incrementing i starting from the new entered number.
Setting conditional breakpoints
Here comes more interesting part. You may set a breakpoint to halt the program execution, if certain condition is satisfied. Right click on the breakpoint to open a context menu and select “Breakpoint Properties”. Change the selection under “Type:” to “Hardware” and enter a “Condition:” like i == 2.
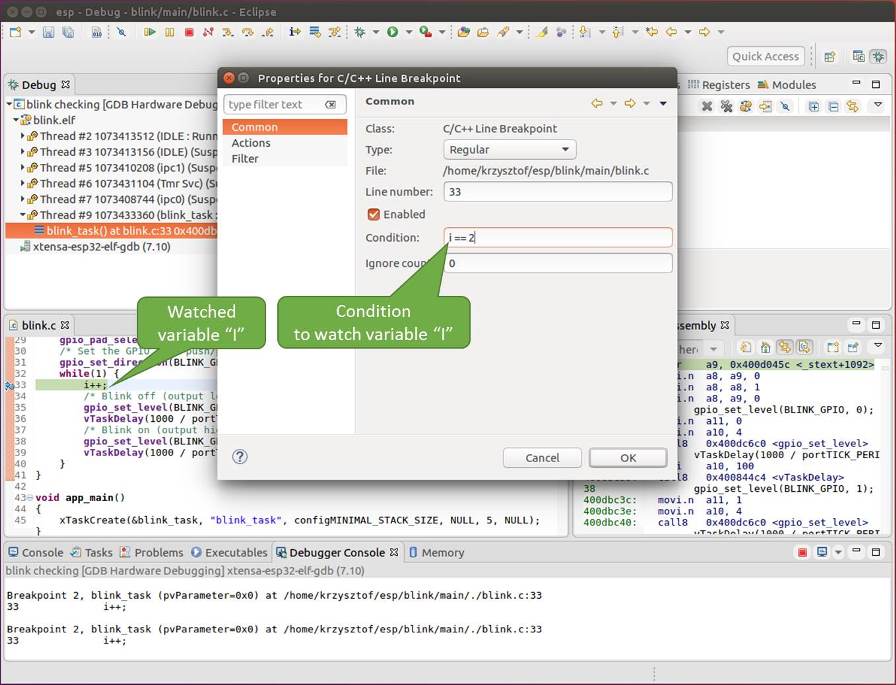
Setting a conditional breakpoint
If current value of i is less than 2 (change it if required) and program is resumed, it will blink LED in a loop until condition i == 2 gets true and then finally halt.
Command Line
Verify if your target is ready and loaded with get-started/blink example. Configure and start debugger following steps in section Command Line. Pick up where target was left by debugger, i.e. having the application halted at breakpoint established at app_main():
Temporary breakpoint 1, app_main () at /home/user-name/esp/blink/main/./blink.c:43
43      xTaskCreate(&blink_task, "blink_task", configMINIMAL_STACK_SIZE, NULL, 5, NULL);
(gdb)
Examples in this section
Navigating through the code, call stack and threads
When you see the (gdb) prompt, the application is halted. LED should not be blinking.
To find out where exactly the code is halted, enter l or list, and debugger will show couple of lines of code around the halt point (line 43 of code in file blink.c)
(gdb) l
38      }
39  }
40
41  void app_main()
42  {
43      xTaskCreate(&blink_task, "blink_task", configMINIMAL_STACK_SIZE, NULL, 5, NULL);
44  }
(gdb)
Check how code listing works by entering, e.g. l 30, 40 to see particular range of lines of code.
You can use bt or backtrace to see what function calls lead up to this code:
(gdb) bt
#0  app_main () at /home/user-name/esp/blink/main/./blink.c:43
#1  0x400d057e in main_task (args=0x0) at /home/user-name/esp/esp-idf/components/esp32/./cpu_start.c:339
(gdb)
Line #0 of output provides the last function call before the application halted, i.e. app_main () we have listed previously. The app_main () was in turn called by function main_task from line 339 of code located in file cpu_start.c.
To get to the context of main_task in file cpu_start.c, enter frame N, where N = 1, because the main_task is listed under #1):
(gdb) frame 1
#1  0x400d057e in main_task (args=0x0) at /home/user-name/esp/esp-idf/components/esp32/./cpu_start.c:339
339     app_main();
(gdb)
Enter l and this will reveal the piece of code that called app_main() (in line 339):
(gdb) l
334         ;
335     }
336 #endif
337     //Enable allocation in region where the startup stacks were located.
338     heap_caps_enable_nonos_stack_heaps();
339     app_main();
340     vTaskDelete(NULL);
341 }
342
(gdb)
By listing some lines before, you will see the function name main_task we have been looking for:
(gdb) l 326, 341
326 static void main_task(void* args)
327 {
328     // Now that the application is about to start, disable boot watchdogs
329     REG_CLR_BIT(TIMG_WDTCONFIG0_REG(0), TIMG_WDT_FLASHBOOT_MOD_EN_S);
330     REG_CLR_BIT(RTC_CNTL_WDTCONFIG0_REG, RTC_CNTL_WDT_FLASHBOOT_MOD_EN);
331 #if !CONFIG_FREERTOS_UNICORE
332     // Wait for FreeRTOS initialization to finish on APP CPU, before replacing its startup stack
333     while (port_xSchedulerRunning[1] == 0) {
334         ;
335     }
336 #endif
337     //Enable allocation in region where the startup stacks were located.
338     heap_caps_enable_nonos_stack_heaps();
339     app_main();
340     vTaskDelete(NULL);
341 }
(gdb)
To see the other code, enter i threads. This will show the list of threads running on target:
(gdb) i threads
  Id   Target Id         Frame
  8    Thread 1073411336 (dport) 0x400d0848 in dport_access_init_core (arg=<optimized out>)
    at /home/user-name/esp/esp-idf/components/esp32/./dport_access.c:170
  7    Thread 1073408744 (ipc0) xQueueGenericReceive (xQueue=0x3ffae694, pvBuffer=0x0, xTicksToWait=1644638200,
    xJustPeeking=0) at /home/user-name/esp/esp-idf/components/freertos/./queue.c:1452
  6    Thread 1073431096 (Tmr Svc) prvTimerTask (pvParameters=0x0)
    at /home/user-name/esp/esp-idf/components/freertos/./timers.c:445
  5    Thread 1073410208 (ipc1 : Running) 0x4000bfea in ?? ()
  4    Thread 1073432224 (dport) dport_access_init_core (arg=0x0)
    at /home/user-name/esp/esp-idf/components/esp32/./dport_access.c:150
  3    Thread 1073413156 (IDLE) prvIdleTask (pvParameters=0x0)
    at /home/user-name/esp/esp-idf/components/freertos/./tasks.c:3282
  2    Thread 1073413512 (IDLE) prvIdleTask (pvParameters=0x0)
    at /home/user-name/esp/esp-idf/components/freertos/./tasks.c:3282
* 1    Thread 1073411772 (main : Running) app_main () at /home/user-name/esp/blink/main/./blink.c:43
(gdb)
The thread list shows the last function calls per each thread together with the name of C source file if available.
You can navigate to specific thread by entering thread N, where N is the thread Id. To see how it works go to thread thread 5:
(gdb) thread 5
[Switching to thread 5 (Thread 1073410208)]
#0  0x4000bfea in ?? ()
(gdb)
Then check the backtrace:
(gdb) bt
#0  0x4000bfea in ?? ()
#1  0x40083a85 in vPortCPUReleaseMutex (mux=<optimized out>) at /home/user-name/esp/esp-idf/components/freertos/./port.c:415
#2  0x40083fc8 in vTaskSwitchContext () at /home/user-name/esp/esp-idf/components/freertos/./tasks.c:2846
#3  0x4008532b in _frxt_dispatch ()
#4  0x4008395c in xPortStartScheduler () at /home/user-name/esp/esp-idf/components/freertos/./port.c:222
#5  0x4000000c in ?? ()
#6  0x4000000c in ?? ()
#7  0x4000000c in ?? ()
#8  0x4000000c in ?? ()
(gdb)
As you see, the backtrace may contain several entries. This will let you check what exact sequence of function calls lead to the code where the target halted. Question marks ?? instead of a function name indicate that application is available only in binary format, without any source file in C language. The value like 0x4000bfea is the memory address of the function call.
Using bt, i threads, thread N and list commands we are now able to navigate through the code of entire application. This comes handy when stepping through the code and working with breakpoints and will be discussed below.
Setting and clearing breakpoints
When debugging, we would like to be able to stop the application at critical lines of code and then examine the state of specific variables, memory and registers / peripherals. To do so we are using breakpoints. They provide a convenient way to quickly get to and halt the application at specific line.
Let’s establish two breakpoints when the state of LED changes. Basing on code listing above this happens at lines 33 and 36. Breakpoints may be established using command break M where M is the code line number:
(gdb) break 33
Breakpoint 2 at 0x400db6f6: file /home/user-name/esp/blink/main/./blink.c, line 33.
(gdb) break 36
Breakpoint 3 at 0x400db704: file /home/user-name/esp/blink/main/./blink.c, line 36.
If you new enter c, the processor will run and halt at a breakpoint. Entering c another time will make it run again, halt on second breakpoint, and so on:
(gdb) c
Continuing.
Target halted. PRO_CPU: PC=0x400DB6F6 (active)    APP_CPU: PC=0x400D10D8

Breakpoint 2, blink_task (pvParameter=0x0) at /home/user-name/esp/blink/main/./blink.c:33
33          gpio_set_level(BLINK_GPIO, 0);
(gdb) c
Continuing.
Target halted. PRO_CPU: PC=0x400DB6F8 (active)    APP_CPU: PC=0x400D10D8
Target halted. PRO_CPU: PC=0x400DB704 (active)    APP_CPU: PC=0x400D10D8

Breakpoint 3, blink_task (pvParameter=0x0) at /home/user-name/esp/blink/main/./blink.c:36
36          gpio_set_level(BLINK_GPIO, 1);
(gdb)
You will be also able to see that LED is changing the state only if you resume program execution by entering c.
To examine how many breakpoints are set and where, use command info break:
(gdb) info break
Num     Type           Disp Enb Address    What
2       breakpoint     keep y   0x400db6f6 in blink_task at /home/user-name/esp/blink/main/./blink.c:33
    breakpoint already hit 1 time
3       breakpoint     keep y   0x400db704 in blink_task at /home/user-name/esp/blink/main/./blink.c:36
    breakpoint already hit 1 time
(gdb)
Please note that breakpoint numbers (listed under Num) start with 2. This is because first breakpoint has been already established at function app_main() by running command thb app_main on debugger launch. As it was a temporary breakpoint, it has been automatically deleted and now is not listed anymore.
To remove breakpoints enter delete N command (in short d N), where N is the breakpoint number:
(gdb) delete 1
No breakpoint number 1.
(gdb) delete 2
(gdb)
Read more about breakpoints under Breakpoints and watchpoints available and What else should I know about breakpoints?
Halting and resuming the application
When debugging, you may resume application and enter code waiting for some event or staying in infinite loop without any break points defined. In such case, to go back to debugging mode, you can break program execution manually by entering Ctrl+C.
To check it delete all breakpoints and enter c to resume application. Then enter Ctrl+C. Application will be halted at some random point and LED will stop blinking. Debugger will print the following:
(gdb) c
Continuing.
^CTarget halted. PRO_CPU: PC=0x400D0C00             APP_CPU: PC=0x400D0C00 (active)
[New Thread 1073433352]

Program received signal SIGINT, Interrupt.
[Switching to Thread 1073413512]
0x400d0c00 in esp_vApplicationIdleHook () at /home/user-name/esp/esp-idf/components/esp32/./freertos_hooks.c:52
52          asm("waiti 0");
(gdb)
In particular case above, the application has been halted in line 52 of code in file freertos_hooks.c. Now you can resume it again by enter c or do some debugging as discussed below.
Note
In MSYS2 shell Ctrl+C does not halt the target but exists debugger. To resolve this issue consider debugging with Eclipse or check a workaround under http://www.mingw.org/wiki/Workaround_for_GDB_Ctrl_C_Interrupt.
Stepping through the code
It is also possible to step through the code using step and next commands (in short s and n). The difference is that step is entering inside subroutines calls, while next steps over the call, treating it as a single source line.
To demonstrate this functionality, using command break and delete discussed in previous paragraph, make sure that you have only one breakpoint defined at line 36 of blink.c:
(gdb) info break
Num     Type           Disp Enb Address    What
3       breakpoint     keep y   0x400db704 in blink_task at /home/user-name/esp/blink/main/./blink.c:36
    breakpoint already hit 1 time
(gdb)
Resume program by entering c and let it halt:
(gdb) c
Continuing.
Target halted. PRO_CPU: PC=0x400DB754 (active)    APP_CPU: PC=0x400D1128

Breakpoint 3, blink_task (pvParameter=0x0) at /home/user-name/esp/blink/main/./blink.c:36
36          gpio_set_level(BLINK_GPIO, 1);
(gdb)
Then enter n couple of times to see how debugger is stepping one program line at a time:
(gdb) n
Target halted. PRO_CPU: PC=0x400DB756 (active)    APP_CPU: PC=0x400D1128
Target halted. PRO_CPU: PC=0x400DB758 (active)    APP_CPU: PC=0x400D1128
Target halted. PRO_CPU: PC=0x400DC04C (active)    APP_CPU: PC=0x400D1128
Target halted. PRO_CPU: PC=0x400DB75B (active)    APP_CPU: PC=0x400D1128
37          vTaskDelay(1000 / portTICK_PERIOD_MS);
(gdb) n
Target halted. PRO_CPU: PC=0x400DB75E (active)    APP_CPU: PC=0x400D1128
Target halted. PRO_CPU: PC=0x400846FC (active)    APP_CPU: PC=0x400D1128
Target halted. PRO_CPU: PC=0x400DB761 (active)    APP_CPU: PC=0x400D1128
Target halted. PRO_CPU: PC=0x400DB746 (active)    APP_CPU: PC=0x400D1128
33          gpio_set_level(BLINK_GPIO, 0);
(gdb)
If you enter s instead, then debugger will step inside subroutine calls:
(gdb) s
Target halted. PRO_CPU: PC=0x400DB748 (active)    APP_CPU: PC=0x400D1128
Target halted. PRO_CPU: PC=0x400DB74B (active)    APP_CPU: PC=0x400D1128
Target halted. PRO_CPU: PC=0x400DC04C (active)    APP_CPU: PC=0x400D1128
Target halted. PRO_CPU: PC=0x400DC04F (active)    APP_CPU: PC=0x400D1128
gpio_set_level (gpio_num=GPIO_NUM_4, level=0) at /home/user-name/esp/esp-idf/components/driver/./gpio.c:183
183     GPIO_CHECK(GPIO_IS_VALID_OUTPUT_GPIO(gpio_num), "GPIO output gpio_num error", ESP_ERR_INVALID_ARG);
(gdb)
In this particular case debugger stepped inside gpio_set_level(BLINK_GPIO, 0) and effectively moved to gpio.c driver code.
See Why stepping with “next” does not bypass subroutine calls? for potential limitation of using next command.
Checking and setting memory
Displaying the contents of memory is done with command x. With additional parameters you may vary the format and count of memory locations displayed. Run help x to see more details. Companion command to x is set that let you write values to the memory.
We will demonstrate how x and set work by reading from and writing to the memory location 0x3FF44004 labeled as GPIO_OUT_REG used to set and clear individual GPIO’s. For more information please refer to ESP32 Technical Reference Manual, chapter IO_MUX and GPIO Matrix.
Being in the same blink.c project as before, set two breakpoints right after gpio_set_level instruction. Enter two times c to get to the break point followed by x /1wx 0x3FF44004 to display contents of GPIO_OUT_REG memory location:
(gdb) c
Continuing.
Target halted. PRO_CPU: PC=0x400DB75E (active)    APP_CPU: PC=0x400D1128
Target halted. PRO_CPU: PC=0x400DB74E (active)    APP_CPU: PC=0x400D1128

Breakpoint 2, blink_task (pvParameter=0x0) at /home/user-name/esp/blink/main/./blink.c:34
34          vTaskDelay(1000 / portTICK_PERIOD_MS);
(gdb) x /1wx 0x3FF44004
0x3ff44004: 0x00000000
(gdb) c
Continuing.
Target halted. PRO_CPU: PC=0x400DB751 (active)    APP_CPU: PC=0x400D1128
Target halted. PRO_CPU: PC=0x400DB75B (active)    APP_CPU: PC=0x400D1128

Breakpoint 3, blink_task (pvParameter=0x0) at /home/user-name/esp/blink/main/./blink.c:37
37          vTaskDelay(1000 / portTICK_PERIOD_MS);
(gdb) x /1wx 0x3FF44004
0x3ff44004: 0x00000010
(gdb)
If your are blinking LED connected to GPIO4, then you should see fourth bit being flipped each time the LED changes the state:
0x3ff44004: 0x00000000
...
0x3ff44004: 0x00000010
Now, when the LED is off, that corresponds to 0x3ff44004: 0x00000000 being displayed, try using set command to set this bit by writting 0x00000010 to the same memory location:
(gdb) x /1wx 0x3FF44004
0x3ff44004: 0x00000000
(gdb) set {unsigned int}0x3FF44004=0x000010
You should see the LED to turn on immediately after entering set {unsigned int}0x3FF44004=0x000010 command.
Watching and setting program variables
A common debugging tasks is checking the value of a program variable as the program runs. To be able to demonstrate this functionality, update file blink.c by adding a declaration of a global variable int i above definition of function blink_task. Then add i++ inside while(1) of this function to get i incremented on each blink.
Exit debugger, so it is not confused with new code, build and flash the code to the ESP and restart debugger. There is no need to restart OpenOCD.
Once application is halted, enter the command watch i:
(gdb) watch i
Hardware watchpoint 2: i
(gdb)
This will insert so called “watchpoint” in each place of code where variable i is being modified. Now enter continue to resume the application and observe it being halted:
(gdb) c
Continuing.
Target halted. PRO_CPU: PC=0x400DB751 (active)    APP_CPU: PC=0x400D0811
[New Thread 1073432196]

Program received signal SIGTRAP, Trace/breakpoint trap.
[Switching to Thread 1073432196]
0x400db751 in blink_task (pvParameter=0x0) at /home/user-name/esp/blink/main/./blink.c:33
33          i++;
(gdb)
Resume application couple more times so i gets incremented. Now you can enter print i (in short p i) to check the current value of i:
(gdb) p i
$1 = 3
(gdb)
To modify the value of i use set command as below (you can then print it out to check if it has been indeed changed):
(gdb) set var i = 0
(gdb) p i
$3 = 0
(gdb)
You may have up to two watchpoints, see Breakpoints and watchpoints available.
Setting conditional breakpoints
Here comes more interesting part. You may set a breakpoint to halt the program execution, if certain condition is satisfied. Delete existing breakpoints and try this:
(gdb) break blink.c:34 if (i == 2)
Breakpoint 3 at 0x400db753: file /home/user-name/esp/blink/main/./blink.c, line 34.
(gdb)
Above command sets conditional breakpoint to halt program execution in line 34 of blink.c if i == 2.
If current value of i is less than 2 and program is resumed, it will blink LED in a loop until condition i == 2 gets true and then finally halt:
(gdb) set var i = 0
(gdb) c
Continuing.
Target halted. PRO_CPU: PC=0x400DB755 (active)    APP_CPU: PC=0x400D112C
Target halted. PRO_CPU: PC=0x400DB753 (active)    APP_CPU: PC=0x400D112C
Target halted. PRO_CPU: PC=0x400DB755 (active)    APP_CPU: PC=0x400D112C
Target halted. PRO_CPU: PC=0x400DB753 (active)    APP_CPU: PC=0x400D112C

Breakpoint 3, blink_task (pvParameter=0x0) at /home/user-name/esp/blink/main/./blink.c:34
34          gpio_set_level(BLINK_GPIO, 0);
(gdb)
Obtaining help on commands
Commands presented so for should provide are very basis and intended to let you quickly get started with JTAG debugging. Check help what are the other commands at you disposal. To obtain help on syntax and functionality of particular command, being at (gdb) prompt type help and command name:
(gdb) help next
Step program, proceeding through subroutine calls.
Usage: next [N]
Unlike "step", if the current source line calls a subroutine,
this command does not enter the subroutine, but instead steps over
the call, in effect treating it as a single source line.
(gdb)
By typing just help, you will get top level list of command classes, to aid you drilling down to more details. Optionally refer to available GDB cheat sheets, for instance http://darkdust.net/files/GDB%20Cheat%20Sheet.pdf. Good to have as a reference (even if not all commands are applicable in an embedded environment).
Ending debugger session
To quit debugger enter q:
(gdb) q
A debugging session is active.

    Inferior 1 [Remote target] will be detached.

Quit anyway? (y or n) y
Detaching from program: /home/user-name/esp/blink/build/blink.elf, Remote target
Ending remote debugging.
user-name@computer-name:~/esp/blink$