HTTP Debugging Tools Tutorial
Note
This document is automatically translated using AI. Please excuse any detailed errors. The official English version is still in progress.
Table of Contents
This article introduces commonly used debugging tools in HTTP development, including Debug Log, local HTTP testing tools, and wireless packet capture, and explains the basic uses and methods of each tool.
Overview
HTTP is a client-server communication protocol based on the Request/Response model, widely used in web browsing, API interface access, and microservice communication. Further explanations and related examples can be found in HTTP Examples.
When developing or debugging HTTP applications, developers may encounter various exceptions, such as connection timeouts, request failures, response delays, or data errors.
When an exception occurs in the program, you can first observe the WARN/ERROR log to quickly locate the general link where the exception occurred:
If the HTTP status code is printed in the log, you can find the meaning of the status code through HTTP Status Code Definition to get the server’s processing result of the request.
If the exception occurs in the request sending or response parsing link, you can first use Local HTTP Testing Tool to troubleshoot server environment problems.
If the above methods cannot locate the problem, and the server and network environment have been confirmed to be normal, you can choose to enable more detailed logs (HTTP Debug Log) or use Wireless Packet Capture for further troubleshooting according to the actual situation.
HTTP Debug Log
HTTP Device-side Log
When troubleshooting HTTP issues, the device-side log can view the internal state of the program and is the main source of information for analyzing the request sending and response receiving process.
Under the default configuration, the device-side log only outputs basic process information, such as whether the request is successfully sent, response status code or error code, to confirm whether the core steps are executed, but it will not show more detailed internal states. Therefore, in some troubleshooting stages, it is necessary to adjust the log level according to the situation to get more details.
The log library has six levels of detail, for details, please refer to Log Level.
HTTP can be simply divided into the following levels:
Application layer: Generates and processes HTTP requests/responses, executes business logic.
TLS layer: Responsible for TLS handshake, certificate verification, and data encryption and decryption, providing a secure communication channel for the upper layer.
lwIP layer: Responsible for TCP/IP encapsulation, network transmission, and connection management.
Wi-Fi layer: Responsible for wireless connection and physical data transmission and reception, it is the lowest level network interface.
The application layer focuses on HTTP messages and business, the TLS layer focuses on data security, the lwIP layer focuses on network transmission, the Wi-Fi layer focuses on wireless transmission and reception, and the log provides debugging information from bottom to top.
The focus of log information at different levels is different, and the method of enabling Debug Log is also different, as explained below.
Modify Maximum Log Level
The global maximum log level determines the upper limit of log output, which is set to INFO level by default. If you need to view DEBUG or VERBOSE level debug logs, you must first raise the global maximum log level. Otherwise, even if the individual module is set to DEBUG or VERBOSE level, DEBUG or VERBOSE level logs cannot be printed.
The method to modify the maximum log level is as follows:
Note
The following menuconfig path is based on ESP-IDF v5.5.2, the location of configuration items may vary in different versions.
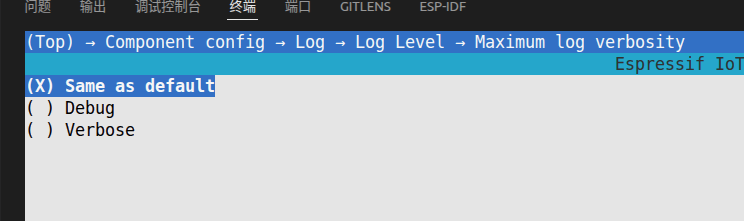
After entering
menuconfig, selectComponent config > Log > Log Level > Maximum log verbosityin order, check theDEBUGoption and save the configuration.
Steps to Enable Application Layer Debug Log
When troubleshooting HTTP application issues, the application layer log is an important source of information for analyzing the client request/response process. The steps to enable the application layer Debug Log are as follows:
Modify Maximum Log Level to DEBUG.
Dynamically modify the log level of the module: You can dynamically modify the log level of the specified module by calling
esp_log_level_set()in the code. For the usage of this API, please refer to Log level control. The recommended modification steps are as follows:
esp_log_level_set("HTTP_CLIENT", ESP_LOG_DEBUG);    // Modify the log level of the HTTP_CLIENT module to DEBUG
esp_log_level_set("HTTP_CLIENT", ESP_LOG_VERBOSE);  // Modify the log level of the HTTP_CLIENT module to VERBOSE
Note
To prevent excessive log volume, it is recommended to set the key modules to be debugged to DEBUG, which can output key logs and control the overall log volume.
Try to avoid setting the log level of all modules to DEBUG or VERBOSE at the same time.
The logs related to the HTTP device side mainly include the following modules (referenced from esp_http_client example):
HTTP_CLIENT: Handles the HTTP protocol process, including constructing requests, parsing response messages, handling redirects and status codes, and is responsible for sending requests and internal state management, used for troubleshooting connection abnormalities, request/response abnormalities or business logic call abnormalities.transport_base: The underlying TCP/TLS transport encapsulation base module, used for troubleshooting TCP connection failures, data send/receive abnormalities or network transmission problems.esp-tls: TLS handshake, certificate loading and verification, used for troubleshooting HTTPS handshake failures, certificate verification failures or encryption suite mismatches.
Steps to Enable TLS Layer Debug Log
In ESP-IDF, the TLS protocol is implemented by the mbedTLS library. The steps to enable the TLS layer Debug Log are as follows:
Modify Maximum Log Level to DEBUG.
Note
The following menuconfig path is based on ESP-IDF v5.5.2, the location of configuration items may vary in different versions.
After entering
menuconfig, selectComponent config > mbedTLSin order, press space to enableEnable mbedTLS debugging
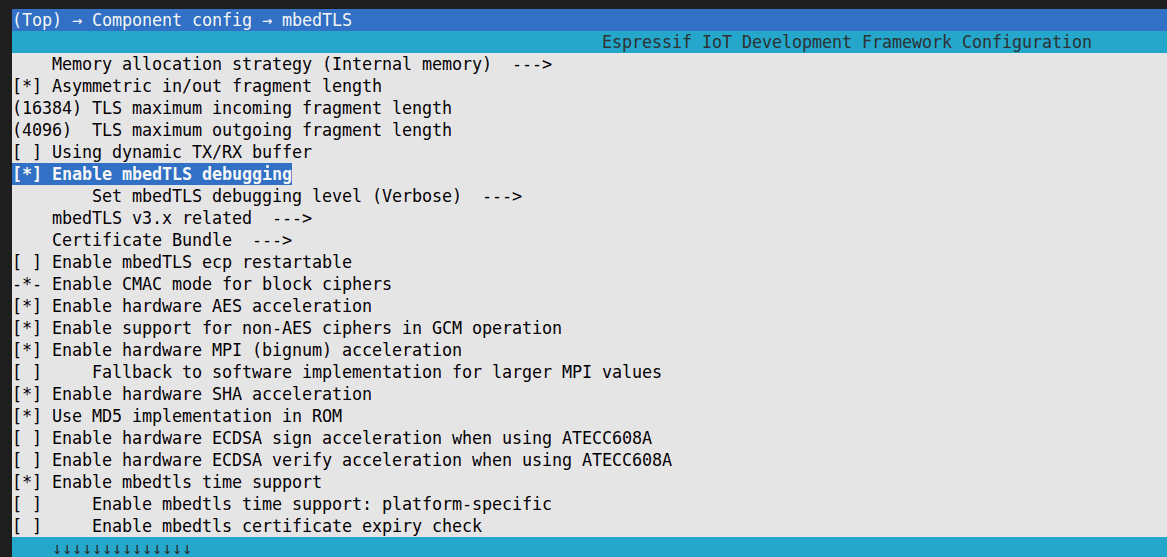
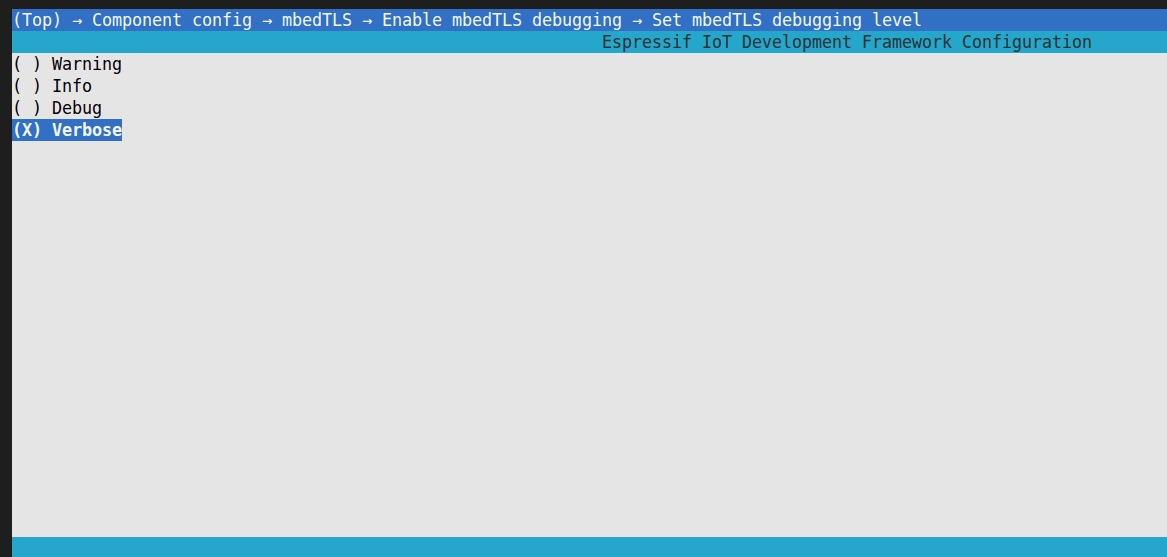
After enabling the log, you can modify the log level through
Set mbedTLS debugging level:
The default log level is VERBOSE, it is recommended to modify it to DEBUG level to control the amount of logs.
Steps to Enable Debug Log at lwIP Layer
The steps to enable Debug Log at lwIP layer are as follows:
Modify Maximum Log Level to DEBUG.
Note
The following menuconfig path is based on ESP-IDF v5.5.2, the location of configuration items may vary in different versions.
After entering
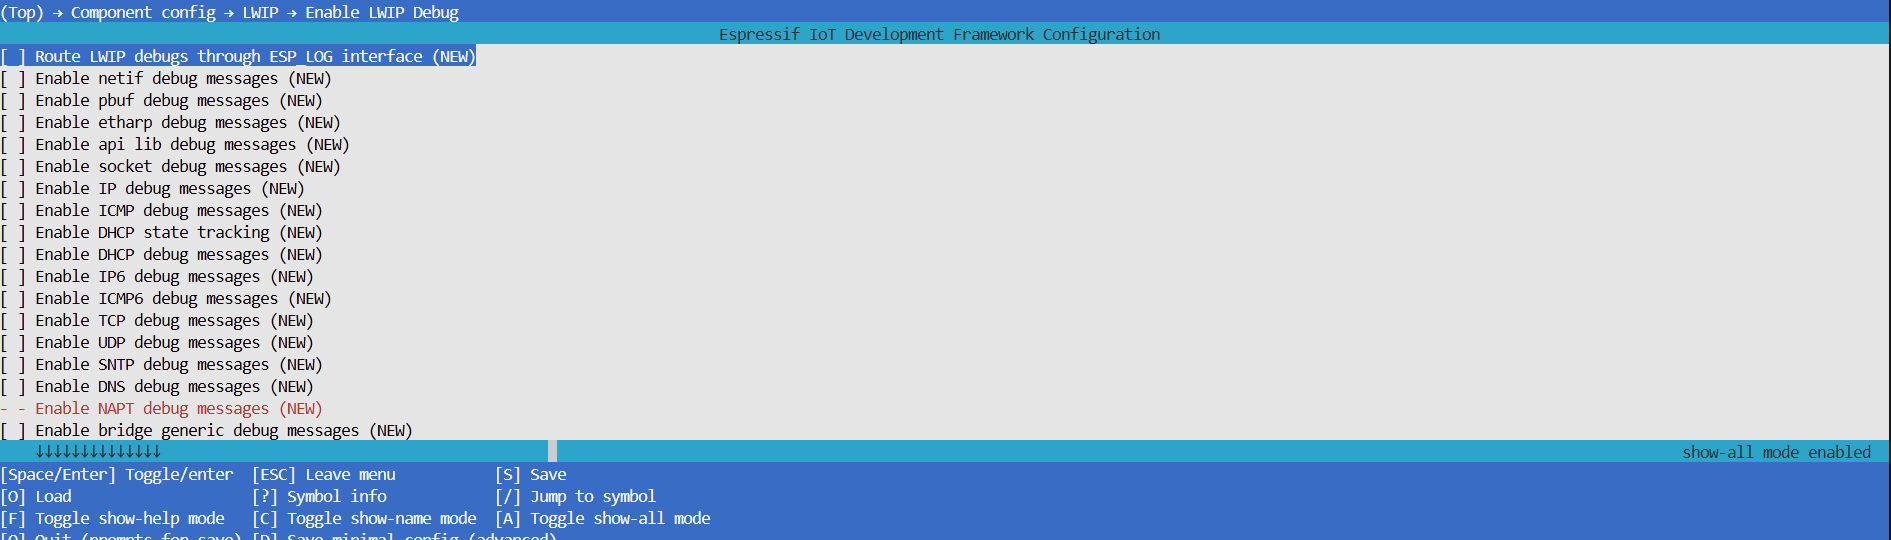
menuconfig, selectComponent config > LWIPin order, press space to enableEnable LWIP Debug
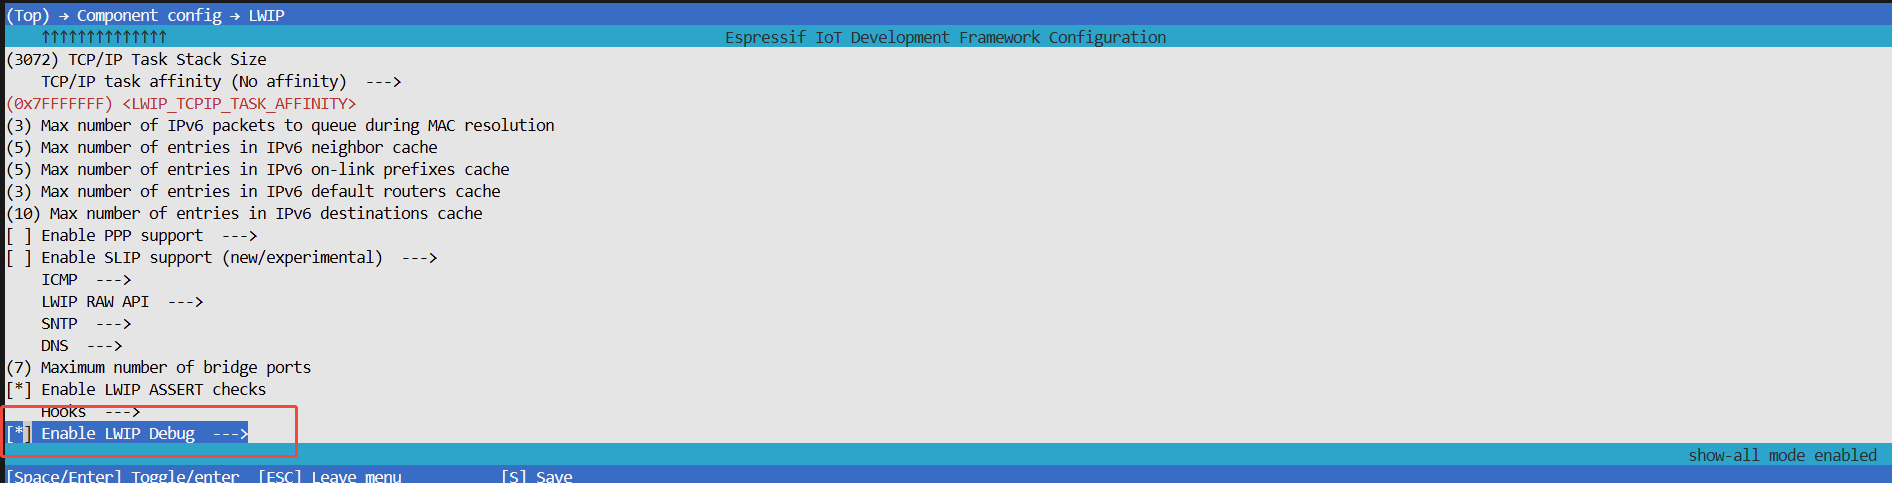
Press enter to enter the
Enable LWIP Debugpage, enable the logs of the corresponding sub-modules as needed, the sub-modules include netif, pbuf, etharp, api lib, socket, IP, ICMP, DHCP, IP6, ICMP6, TCP, UDP, SNTP, DNS, bridge generic, bridge FDB, bridge forwarding.
For further instructions on enabling debug logs at the lwIP layer, please refer to this ESP-FAQ.
Steps to Enable Debug Log at Wi-Fi Layer
In ESP-IDF, Wi-Fi connection related logs are mainly distributed in the wifi and wpa modules, corresponding to link management and wireless security authentication. The steps to enable Debug Log at Wi-Fi layer are as follows:
Modify Maximum Log Level to DEBUG.
View debug logs of wifi module: The logs of the
wifimodule are enabled by default, you can modify its log level to DEBUG by callingesp_log_level_set()in the code, for the usage of this API, please refer to Log Level Control. The recommended modification steps are as follows:
esp_log_level_set("wifi", ESP_LOG_DEBUG);
View debug logs of wpa module: The logs of the
wpamodule are disabled by default, the steps to enable them are as follows.
Note
The following menuconfig path is based on ESP-IDF v5.5.0, the location of configuration items may vary in different versions.
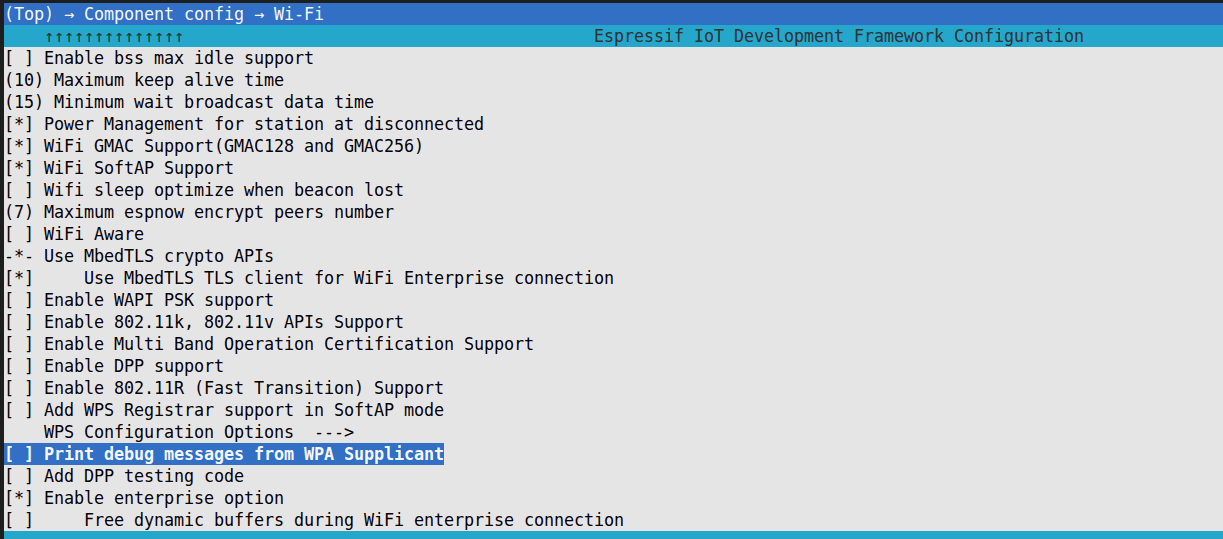
After entering
menuconfig, selectComponent config > Wi-Fiin order, press space to enablePrint debug messages from WPA Supplicant.
Call
esp_log_level_set()in the code to change its log level to DEBUG, for the usage of this API, please refer to Log Level Control. The recommended modification steps are as follows:
esp_log_level_set("wpa", ESP_LOG_DEBUG);
Local HTTP Testing Tool
Testing Tool Use Cases
The HTTP testing tool is used to simulate client requests to the server, it runs independently of the device side, and can quickly confirm whether the HTTP server and network environment are normal, thus assisting in troubleshooting and reducing misjudgments or repeated debugging caused by environmental abnormalities:
If the testing tool cannot connect to the target URI, the problem usually lies in the network from the router to the server or the server itself.
If the testing tool connects normally, the problem usually lies in the network from the router to the device or the device-side code.
For issues confirmed to be on the device side, further analysis is needed in conjunction with HTTP Debug Log or Wireless Packet Capture, to further check the device’s network configuration and program logic.
Common Testing Tools
In HTTP development and debugging, local testing tools are mainly used to verify the connection between the client and the server, debug requests/responses, check Header and Body configurations, and simulate client behavior. These tools can quickly help developers confirm whether communication is normal, and also support batch requests and automated testing.
Common local testing tools can be divided into two categories: Graphical User Interface (GUI) tools and Command Line Interface (CLI) tools.
GUI tools provide visual operations, which are convenient for intuitively configuring request URLs, Headers, and Bodies, and viewing returned status codes and response content, suitable for quickly verifying interface behavior during debugging.
CLI tools initiate requests through commands or scripts, which are more suitable for batch request testing, automated verification, and use in environments without a graphical interface.
In actual development, GUI tools are usually used for interface debugging and problem reproduction, while CLI tools are more often used for scripted testing, continuous integration, or large-scale request verification.
Common local HTTP testing tools include:
Postman: Provides a complete GUI operation interface, can build request collections, view response status and content, supports environment variables and scripted testing.
HTTPie: Both CLI and GUI versions are available. The CLI version supports intuitive formatting of requests and responses, suitable for quick debugging and automated interface verification; the GUI version is convenient for visual operation and management of request collections.
cURL: Lightweight CLI tool, supports almost all HTTP methods and request parameter configurations, suitable for interface debugging, performance testing, or automated script execution in environments without a GUI.
Testing Tool Usage Instructions
Wireless Packet Capture
Wireless packet capture can directly display real network packets, mainly used for troubleshooting network layer or transport layer anomalies, such as request timeouts, response delays, or connection failures, etc., to confirm whether the underlying link between the client and the server is stable and reliable.
Before entering the packet capture phase, the following pre-verification needs to be completed to avoid invalid packet capture:
Use HTTP testing tools to confirm that the server service is normal, the network link is reachable, the port/firewall configuration is effective, and the TLS certificate is compatible.
Use Debug Log to confirm that the request parameters (URL, Header, Body, etc.) are correctly configured, the certificate is loaded normally, and the SDK connection process has no clear error codes or abnormal logs.
When the testing tool runs normally, and the Debug Log does not find any clear problems, but there are still unstable connections, packet loss, frequent disconnections, etc., packet capture is needed for further positioning.
The steps for wireless packet capture can refer to Wireless Packet Capture Tutorial.