Application Level Tracing Transport (apptrace)
The Application Level Tracing library (the app_trace component) is the default transport used by the esp_trace tracing system. It transfers arbitrary data between the host and ESP32-C6 via the JTAG or UART interface with small overhead on program execution. It is possible to use the JTAG and UART interfaces simultaneously. The UART interface is mostly used for connection with the SEGGER SystemView tool (see System Behavior Analysis with SEGGER SystemView). Tracing over the USB Serial JTAG peripheral is provided by a separate transport, not by apptrace.
This page documents the transport itself: how to configure it, how to send and receive arbitrary application data through it, and the host-side OpenOCD commands used to collect that data. Higher-level features built on top of this transport are documented separately:
System behavior analysis with SEGGER SystemView: see System Behavior Analysis with SEGGER SystemView.
Source code coverage with Gcov: see Gcov (Source Code Coverage).
Plugging in your own trace recorder: see Integrating a Custom Trace Library.
Overview
Developers can use this library to send application-specific state of execution to the host and receive commands or other types of information from the opposite direction at runtime. The main standalone use cases of this library are:
Collecting application-specific data. See Application Specific Tracing.
Lightweight logging to the host. See Logging to Host.
Tracing components used when working over the JTAG interface are shown in the figure below.
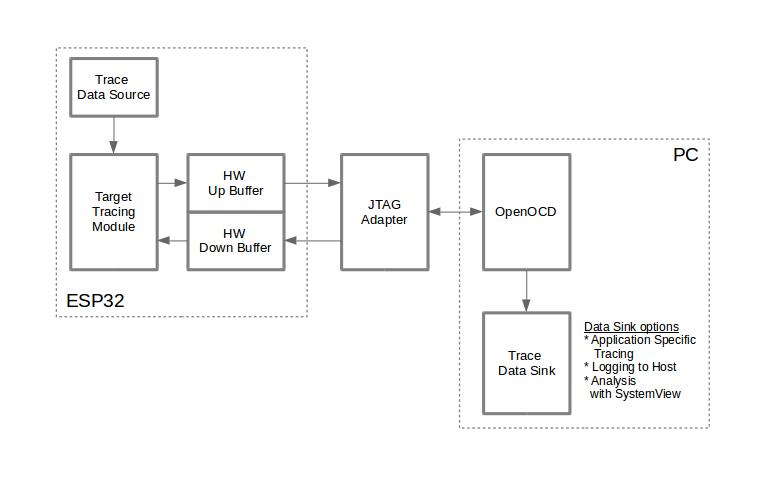
Tracing Components Used When Working Over JTAG
Modes of Operation
The library supports two modes of operation:
Post-mortem mode: This is the default mode. The mode does not need interaction with the host side. In this mode, tracing module does not check whether the host has read all the data from HW UP BUFFER, but directly overwrites old data with the new ones. This mode is useful when only the latest trace data is interesting to the user, e.g., for analyzing program's behavior just before the crash. The host can read the data later on upon user request, e.g., via special OpenOCD command in case of working via JTAG interface.
Streaming mode: Tracing module enters this mode when the host connects to ESP32-C6. In this mode, before writing new data to HW UP BUFFER, the tracing module checks that whether there is enough space in it and if necessary, waits for the host to read data and free enough memory. Maximum waiting time is controlled via timeout values passed by users to corresponding API routines. So when application tries to write data to the trace buffer using the finite value of the maximum waiting time, it is possible that this data will be dropped. This is especially true for tracing from time-critical code (ISRs, OS scheduler code, etc.) where infinite timeouts can lead to system malfunction.
Configuration Options and Dependencies
Using of this feature depends on two components:
Host side: Application tracing is done over JTAG, so it needs OpenOCD to be set up and running on host machine. For instructions on how to set it up, please see JTAG Debugging for details.
Target side: Application tracing functionality can be enabled in menuconfig. Important: You must first set to
ESP-IDF apptrace. The related application-level tracing options will then become available. Here you can configure the destination for the trace data. For UART interfaces, users have to define port number, baud rate, TX and RX pins numbers, and additional UART-related parameters. When any trace library is selected (for example SEGGER SystemView), these settings will be used for the library as well.
Note
In order to achieve higher data rates and minimize the number of dropped packets, it is recommended to optimize the setting of JTAG clock frequency, so that it is at maximum and still provides stable operation of JTAG. See Optimize JTAG Speed.
There are some additional menuconfig options not mentioned above:
Threshold for flushing last trace data to host on panic (). This option is necessary due to the nature of working over JTAG. In this mode, trace data is exposed to the host in 16 KB blocks. In post-mortem mode, when one block is filled, it is exposed to the host and the previous one becomes unavailable. In other words, the trace data is overwritten in 16 KB granularity. On panic, the latest data from the current input block is exposed to the host and the host can read them for post-analysis. System panic may occur when a very small amount of data are not exposed to the host yet. In this case, the previous 16 KB of collected data will be lost and the host will see the latest, but very small piece of the trace. It can be insufficient to diagnose the problem. This menuconfig option allows avoiding such situations. It controls the threshold for flushing data in case of apanic. For example, you can decide that it needs no less than 512 bytes of the recent trace data, so if there is less than 512 bytes of pending data at the moment of panic, they will not be flushed and will not overwrite the previous 16 KB. The option is only meaningful in post-mortem mode and when working over JTAG.
Timeout for flushing last trace data to host on panic (). The option is only meaningful in streaming mode and it controls the maximum time that the tracing module will wait for the host to read the last data in case of panic.
Internal Sync Lock (). Enable this option to protect trace buffer writes with locks, preventing data corruption when multiple tasks generate trace data concurrently.
UART RX/TX ring buffer size (). The size of the buffer depends on the amount of data transferred through the UART.
UART TX message size (). The maximum size of the single message to transfer.
How to Use This Library
This library provides APIs for transferring arbitrary data between the host and ESP32-C6. When enabled in menuconfig, the application tracing module is automatically initialized during system startup using configuration from menuconfig. You can then call corresponding APIs to send, receive, or flush the data.
Optionally, users can override the default configuration by implementing the weak callback function esp_apptrace_get_user_params(). This callback will be active when there is no selected trace library, meaning the Application Level Tracing library (app_trace component) will be working standalone. Otherwise, esp_trace_get_user_params() will be used for overriding the configuration.
Quick Start Summary
Standalone usage with Application Level Tracing APIs
In menuconfig, disable the trace library and enable the Application Level Tracing transport:
Set to
NoneSet to
ESP-IDF apptrace
Alternatively, set these options in
sdkconfig.defaultsto enforce standalone mode:CONFIG_ESP_TRACE_ENABLE=y CONFIG_ESP_TRACE_LIB_NONE=y CONFIG_ESP_TRACE_TRANSPORT_APPTRACE=y
Configure the destination with .
Runtime configuration via
esp_apptrace_get_user_params()If you select
All (runtime selection)in Kconfig (APPTRACE_DEST_ALL), the callback can switch between JTAG and UART at runtime and adjust their parameters.If you select a single destination (JTAG or UART) in Kconfig, the callback can override that destination's parameters at runtime, but it cannot switch the destination type.
Note
Application tracing can also work as a transport adapter to the esp_trace library. In this case, the Application Level Tracing library will not be used directly, but rather through the selected esp_trace library with new APIs. See Tracing.
Note
The code examples below are valid when the Application Level Tracing library is used standalone without a trace library.
Application Specific Tracing
In general, you should decide what type of data should be transferred in every direction and how these data must be interpreted (processed). The following steps must be performed to transfer data between the target and the host:
Configuration: Application tracing is automatically initialized during system startup using configuration from menuconfig. If you need to override the default configuration at runtime (e.g., to use custom UART pins), implement the
esp_apptrace_get_user_params()callback:#include "esp_app_trace.h" esp_apptrace_config_t *esp_apptrace_get_user_params(void) { esp_apptrace_config_t config = APPTRACE_CONFIG_DEFAULT(); // Customize configuration if needed // For example, to use different UART pins: config.dest_cfg.uart.tx_pin_num = GPIO_NUM_17; config.dest_cfg.uart.rx_pin_num = GPIO_NUM_16; return config; }
Note
This callback is optional. Only implement it if you need to override menuconfig settings. For most use cases, configuring through menuconfig is sufficient.
On the target side, users should implement algorithms for writing trace data to the host. Piece of code below shows an example on how to do this.
#include "esp_app_trace.h"
...
char buf[] = "Hello World!";
esp_err_t res = esp_apptrace_write(buf, strlen(buf), ESP_APPTRACE_TMO_INFINITE);
if (res != ESP_OK) {
    ESP_LOGE(TAG, "Failed to write data to host!");
    return res;
}
The
esp_apptrace_write()function uses memcpy to copy user data to the internal buffer. In some cases, it can be more optimal to useesp_apptrace_buffer_get()andesp_apptrace_buffer_put()functions. They allow developers to allocate buffer and fill it themselves. The following piece of code shows how to do this.#include "esp_app_trace.h" ... int number = 10; char *ptr = (char *)esp_apptrace_buffer_get(32, 100/*tmo in us*/); if (ptr == NULL) { ESP_LOGE(TAG, "Failed to get buffer!"); return ESP_FAIL; } sprintf(ptr, "Here is the number %d", number); esp_err_t res = esp_apptrace_buffer_put(ptr, 100/*tmo in us*/); if (res != ESP_OK) { /* in case of error host tracing tool (e.g., OpenOCD) will report incomplete user buffer */ ESP_LOGE(TAG, "Failed to put buffer!"); return res; }
If you need to receive data from the host. Piece of code below shows an example on how to do this.
#include "esp_app_trace.h"
...
char buf[32];
char down_buf[32];
size_t sz = sizeof(buf);

/* config down buffer */
esp_err_t res = esp_apptrace_down_buffer_config(down_buf, sizeof(down_buf));
if (res != ESP_OK) {
    ESP_LOGE(TAG, "Failed to config down buffer!");
    return res;
}
/* check for incoming data and read them if any */
res = esp_apptrace_read(buf, &sz, 0/*do not wait*/);
if (res != ESP_OK) {
    ESP_LOGE(TAG, "Failed to read data from host!");
    return res;
}
if (sz > 0) {
    /* we have data, process them */
    ...
}
The
esp_apptrace_read()function uses memcpy to copy host data to user buffer. In some cases, it can be more optimal to useesp_apptrace_down_buffer_get()andesp_apptrace_down_buffer_put()functions. They allow developers to occupy chunk of read buffer and process it in-place. The following piece of code shows how to do this.#include "esp_app_trace.h" ... char down_buf[32]; uint32_t *number; size_t sz = 32; /* config down buffer */ esp_err_t res = esp_apptrace_down_buffer_config(down_buf, sizeof(down_buf)); if (res != ESP_OK) { ESP_LOGE(TAG, "Failed to config down buffer!"); return res; } char *ptr = (char *)esp_apptrace_down_buffer_get(&sz, 100/*tmo in us*/); if (ptr == NULL) { ESP_LOGE(TAG, "Failed to get buffer!"); return ESP_FAIL; } if (sz > 4) { number = (uint32_t *)ptr; printf("Here is the number %d", *number); } else { printf("No data"); } res = esp_apptrace_down_buffer_put(ptr, 100/*tmo in us*/); if (res != ESP_OK) { /* in case of error host tracing tool (e.g., OpenOCD) will report incomplete user buffer */ ESP_LOGE(TAG, "Failed to put buffer!"); return res; }
The next step is to build the program image and download it to the target as described in the Getting Started Guide.
Run OpenOCD (see JTAG Debugging).
Connect to OpenOCD telnet server. It can be done using the following command in terminal
telnet <oocd_host> 4444. If telnet session is opened on the same machine which runs OpenOCD, you can uselocalhostas<oocd_host>in the command above.Start trace data collection using special OpenOCD command. This command will transfer tracing data and redirect them to the specified file or socket. For description of the corresponding commands, see OpenOCD Application Level Tracing Commands.
The final step is to process received data. Since the format of data is defined by users, the processing stage is out of the scope of this document. Good starting points for data processor are python scripts in
$IDF_PATH/tools/esp_app_trace:sysviewtrace_proc.py(used for feature tests) andlogtrace_proc.py(see more details in section Logging to Host).
OpenOCD Application Level Tracing Commands
HW UP BUFFER is shared between user data blocks and the filling of the allocated memory is performed on behalf of the API caller (in task or ISR context). In multithreading environment, it can happen that the task/ISR which fills the buffer is preempted by another high priority task/ISR. So it is possible that the user data preparation process is not completed at the moment when that chunk is read by the host. To handle such conditions, the tracing module prepends all user data chunks with header which contains the allocated user buffer size (2 bytes) and the length of the actually written data (2 bytes). So the total length of the header is 4 bytes. OpenOCD command which reads trace data reports error when it reads incomplete user data chunk, but in any case, it puts the contents of the whole user chunk (including unfilled area) to the output file.
Below is the description of available OpenOCD application tracing commands.
Note
Currently, OpenOCD does not provide commands to send arbitrary user data to the target.
Command usage:
esp apptrace [start <options>] | [stop] | [status] | [dump <cores_num> <outfile>]
Sub-commands:
startStart tracing (continuous streaming).
stopStop tracing.
statusGet tracing status.
dumpDump all data from (post-mortem dump).
Start command syntax:
start <outfile> [poll_period [trace_size [stop_tmo [wait4halt [skip_size]]]]
outfilePath to file to save data from both CPUs. This argument should have the following format:
file://path/to/file.poll_periodData polling period (in ms) for available trace data. If greater than 0, then command runs in non-blocking mode. By default, 1 ms.
trace_sizeMaximum size of data to collect (in bytes). Tracing is stopped after specified amount of data is received. By default, -1 (trace size stop trigger is disabled).
stop_tmoIdle timeout (in sec). Tracing is stopped if there is no data for specified period of time. By default, -1 (disable this stop trigger). Optionally set it to value longer than longest pause between tracing commands from target.
wait4haltIf 0, start tracing immediately, otherwise command waits for the target to be halted (after reset, by breakpoint etc.) and then automatically resumes it and starts tracing. By default, 0.
skip_sizeNumber of bytes to skip at the start. By default, 0.
Note
If poll_period is 0, OpenOCD telnet command line will not be available until tracing is stopped. You must stop it manually by resetting the board or pressing Ctrl+C in OpenOCD window (not one with the telnet session). Another option is to set trace_size and wait until this size of data is collected. At this point, tracing stops automatically.
Command usage examples:
Collect 2048 bytes of tracing data to the file
trace.log. The file will be saved in theopenocd-esp32directory.esp apptrace start file://trace.log 1 2048 5 0 0
The tracing data will be retrieved and saved in non-blocking mode. This process will stop automatically after 2048 bytes are collected, or if no data are available for more than 5 seconds.
Note
Tracing data is buffered before it is made available to OpenOCD. If you see "Data timeout!" message, then it is likely that the target is not sending enough data to empty the buffer to OpenOCD before the timeout. Either increase the timeout or use the function
esp_apptrace_flush()to flush the data on specific intervals.Retrieve tracing data indefinitely in non-blocking mode.
esp apptrace start file://trace.log 1 -1 -1 0 0
There is no limitation on the size of collected data and there is no data timeout set. This process may be stopped by issuing
esp apptrace stopcommand on OpenOCD telnet prompt, or by pressing Ctrl+C in OpenOCD window.Retrieve tracing data and save them indefinitely.
esp apptrace start file://trace.log 0 -1 -1 0 0
OpenOCD telnet command line prompt will not be available until tracing is stopped. To stop tracing, press Ctrl+C in the OpenOCD window.
Wait for the target to be halted. Then resume the target's operation and start data retrieval. Stop after collecting 2048 bytes of data:
esp apptrace start file://trace.log 0 2048 -1 1 0
To configure tracing immediately after reset, use the OpenOCD
reset haltcommand.
Logging to Host
ESP-IDF implements a useful feature: logging to the host via application level tracing library. This is a kind of semihosting when all ESP_LOGx calls send strings to be printed to the host instead of UART. This can be useful because "printing to host" eliminates some steps performed when logging to UART. Most part of the work is done on the host.
By default, ESP-IDF's logging library uses vprintf-like function to write formatted output to dedicated UART. In general, it involves the following steps:
Format string is parsed to obtain type of each argument.
According to its type, every argument is converted to string representation.
Format string combined with converted arguments is sent to UART.
Though the implementation of the vprintf-like function can be optimized to a certain level, all steps above have to be performed in any case and every step takes some time (especially item 3). So it frequently occurs that with additional log added to the program to identify the problem, the program behavior is changed and the problem cannot be reproduced. And in the worst cases, the program cannot work normally at all and ends up with an error or even hangs.
Possible ways to overcome this problem are to use higher UART bitrates (or another faster interface) and to move string formatting procedure to the host.
The application level tracing feature can be used to transfer log information to the host using esp_apptrace_vprintf function. This function does not perform full parsing of the format string and arguments. Instead, it just calculates the number of arguments passed and sends them along with the format string address to the host. On the host, log data is processed and printed out by a special Python script.
Limitations
Current implementation of logging over JTAG has some limitations:
No support for tracing from
ESP_EARLY_LOGxmacros.No support for printf arguments whose size exceeds 4 bytes (e.g.,
doubleanduint64_t).Only strings from the .rodata section are supported as format strings and arguments.
The maximum number of printf arguments is 256.
How to Use It
In order to use logging via trace module, you need to perform the following steps:
Enable application tracing by setting to
ESP-IDF apptrace. The related application-level tracing options will then become available.On the target side, the special vprintf-like function
esp_apptrace_vprintf()needs to be installed. It sends log data to the host. An example isesp_log_set_vprintf(esp_apptrace_vprintf);. To send log data to UART again, useesp_log_set_vprintf(vprintf);.Follow instructions in items 4-6 in Application Specific Tracing (OpenOCD setup and trace collection).
To print out collected log records, run the following command in terminal:
$IDF_PATH/tools/esp_app_trace/logtrace_proc.py /path/to/trace/file /path/to/program/elf/file.
Log Trace Processor Command Options
Command usage:
logtrace_proc.py [-h] [--no-errors] <trace_file> <elf_file>
Positional arguments:
trace_filePath to log trace file.
elf_filePath to program ELF file.
Optional arguments:
-h,--helpShow this help message and exit.
--no-errors,-nDo not print errors.
Application Examples
system/tracing/app_trace_basic demonstrates how to use the Application Level Tracing Library to log messages to a host via JTAG, providing a faster alternative to UART logs.
system/tracing/app_trace_to_plot demonstrates how to send and plot dummy sensor data to a host via JTAG.
API Reference
For the transport API, see Application Level Tracing. For the high-level esp_trace API, see ESP Trace.