Using Debugger
This section covers configuration and running debugger from Eclipse or from Command Line or using Using idf.py debug targets. It is recommended to first check if debugger works from Command Line and then move to using Eclipse.
Eclipse
Debugging functionality is provided out of box in standard Eclipse installation. Another option is to use pluggins like “GDB Hardware Debugging” plugin. We have found this plugin quite convenient and decided to use throughout this guide.
To begin with, install “GDB Hardware Debugging” plugin by opening Eclipse and going to Help > Install New Software.
Once installation is complete, configure debugging session following steps below. Please note that some of configuration parameters are generic and some are project specific. This will be shown below by configuring debugging for “blink” example project. If not done already, add this project to Eclipse workspace following guidance in section Build and Flash with Eclipse IDE. The source of get-started/blink application is available in examples directory of ESP-IDF repository.
In Eclipse go to Run > Debug Configuration. A new window will open. In the window’s left pane double click “GDB Hardware Debugging” (or select “GDB Hardware Debugging” and press the “New” button) to create a new configuration.
In a form that will show up on the right, enter the “Name:” of this configuration, e.g. “Blink checking”.
On the “Main” tab below, under “Project:”, press “Browse” button and select the “blink” project.
In next line “C/C++ Application:” press “Browse” button and select “blink.elf” file. If “blink.elf” is not there, then likely this project has not been build yet. See Build and Flash with Eclipse IDE how to do it.
Finally, under “Build (if required) before launching” click “Disable auto build”.
A sample window with settings entered in points 1 - 5 is shown below.
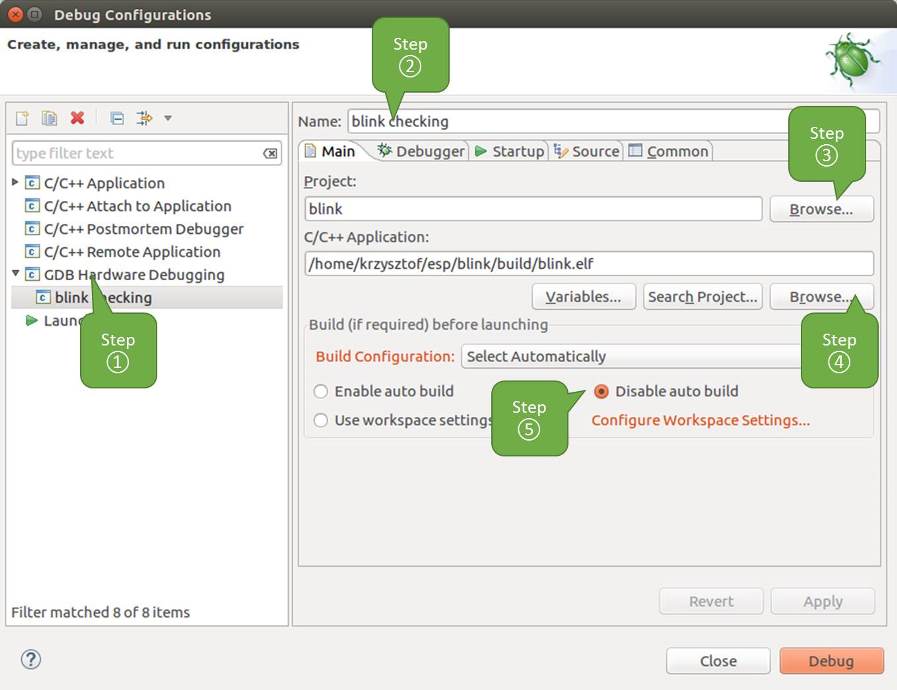
Configuration of GDB Hardware Debugging - Main tab
Click “Debugger” tab. In field “GDB Command” enter
xtensa-esp32s2-elf-gdbto invoke debugger.Change default configuration of “Remote host” by entering
3333under the “Port number”.Configuration entered in points 6 and 7 is shown on the following picture.
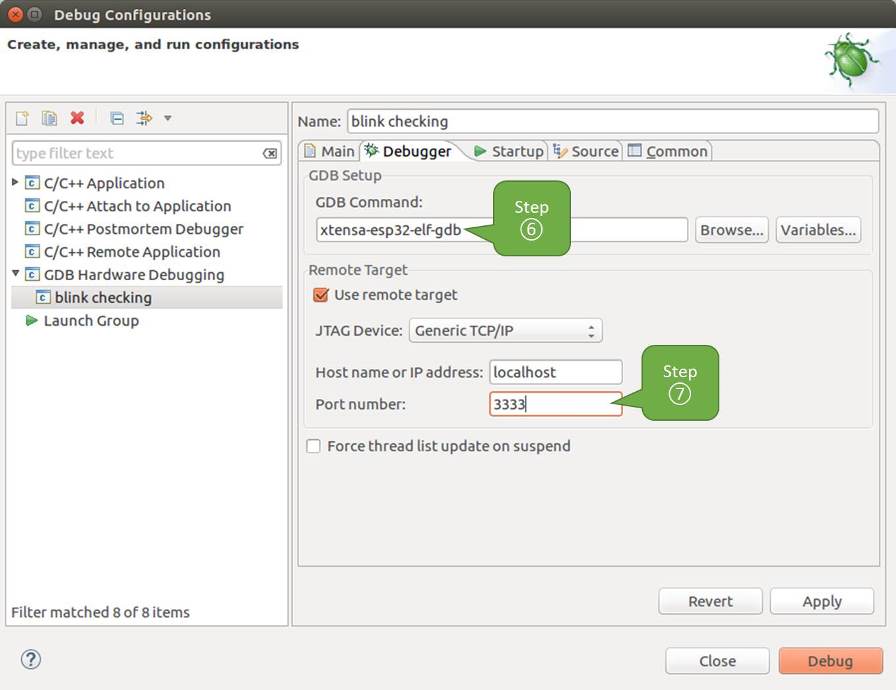
Configuration of GDB Hardware Debugging - Debugger tab
The last tab to that requires changing of default configuration is “Startup”. Under “Initialization Commands” uncheck “Reset and Delay (seconds)” and “Halt””. Then, in entry field below, enter the following lines:
mon reset halt
flushregs
set remote hardware-watchpoint-limit 2
Note
If you want to update image in the flash automatically before starting new debug session add the following lines of commands at the beginning of “Initialization Commands” textbox:
mon reset halt
mon program_esp ${workspace_loc:blink/build/blink.bin} 0x10000 verify
For description of
program_espcommand see Upload application for debugging.Under “Load Image and Symbols” uncheck “Load image” option.
Further down on the same tab, establish an initial breakpoint to halt CPUs after they are reset by debugger. The plugin will set this breakpoint at the beginning of the function entered under “Set break point at:”. Checkout this option and enter
app_mainin provided field.Checkout “Resume” option. This will make the program to resume after
mon reset haltis invoked per point 8. The program will then stop at breakpoint inserted atapp_main.Configuration described in points 8 - 11 is shown below.
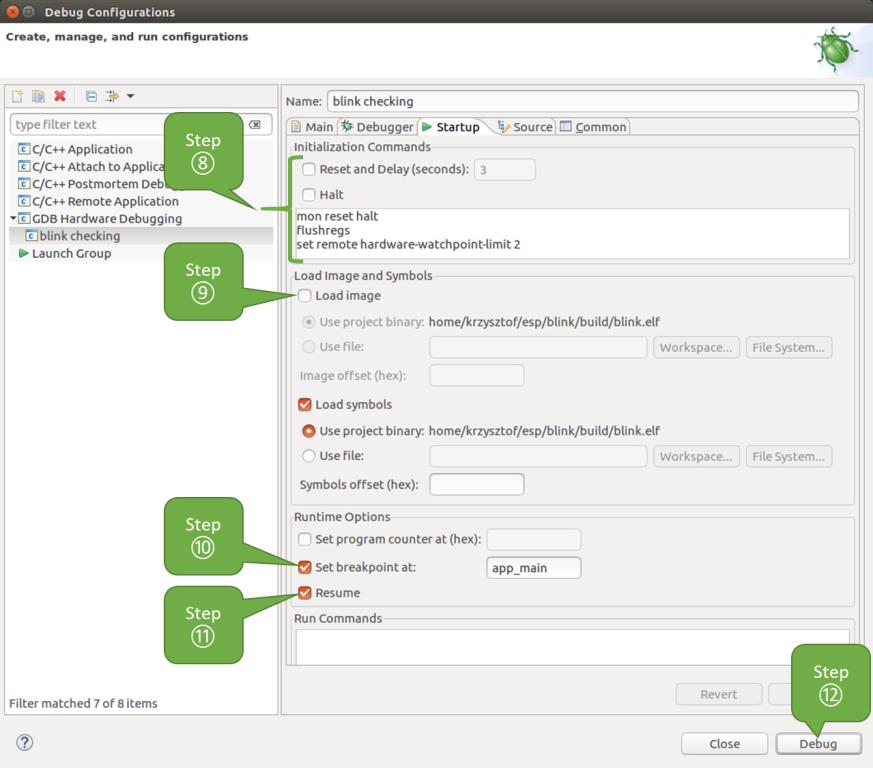
Configuration of GDB Hardware Debugging - Startup tab
If the “Startup” sequence looks convoluted and respective “Initialization Commands” are not clear to you, check What is the meaning of debugger’s startup commands? for additional explanation.
If you previously completed Configuring ESP32-S2 Target steps described above, so the target is running and ready to talk to debugger, go right to debugging by pressing “Debug” button. Otherwise press “Apply” to save changes, go back to Configuring ESP32-S2 Target and return here to start debugging.
Once all 1 - 12 configuration steps are satisfied, the new Eclipse perspective called “Debug” will open as shown on example picture below.
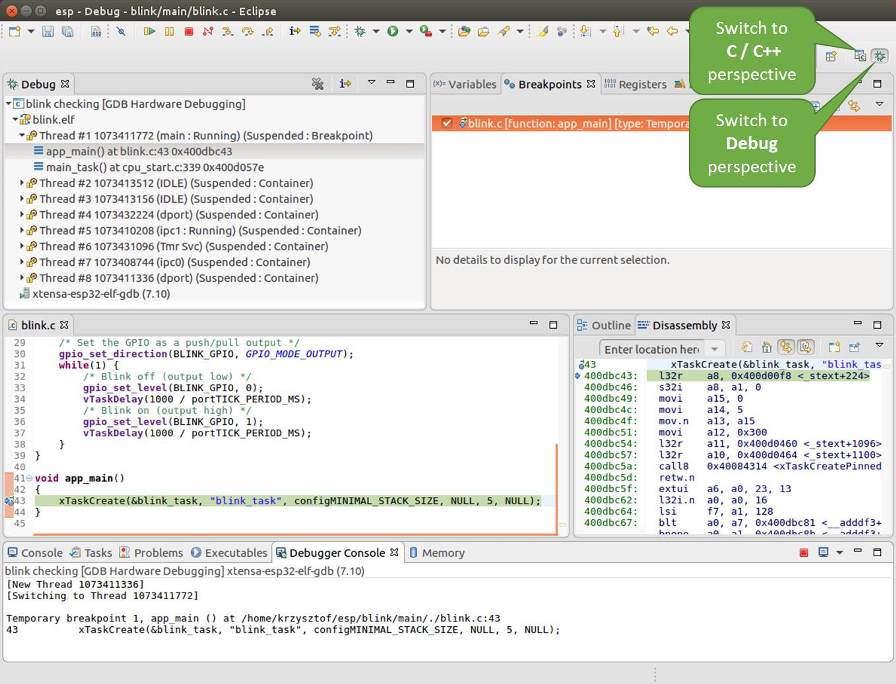
Debug Perspective in Eclipse
If you are not quite sure how to use GDB, check Eclipse example debugging session in section Debugging Examples.
Command Line
Begin with completing steps described under Configuring ESP32-S2 Target. This is prerequisite to start a debugging session.
Open a new terminal session and go to directory that contains project for debugging, e.g.
cd ~/esp/blink
When launching a debugger, you will need to provide couple of configuration parameters and commands. Instead of entering them one by one in command line, create a configuration file and name it
gdbinit:target remote :3333 set remote hardware-watchpoint-limit 2 mon reset halt flushregs thb app_main c
Save this file in current directory.
For more details what’s inside
gdbinitfile, see What is the meaning of debugger’s startup commands?
Now you are ready to launch GDB. Type the following in terminal:
xtensa-esp32s2-elf-gdb -x gdbinit build/blink.elf
If previous steps have been done correctly, you will see a similar log concluded with
(gdb)prompt:user-name@computer-name:~/esp/blink$ xtensa-esp32s2-elf-gdb -x gdbinit build/blink.elf GNU gdb (crosstool-NG crosstool-ng-1.22.0-61-gab8375a) 7.10 Copyright (C) 2015 Free Software Foundation, Inc. License GPLv3+: GNU GPL version 3 or later <http://gnu.org/licenses/gpl.html> This is free software: you are free to change and redistribute it. There is NO WARRANTY, to the extent permitted by law. Type "show copying" and "show warranty" for details. This GDB was configured as "--host=x86_64-build_pc-linux-gnu --target=xtensa-esp32s2-elf". Type "show configuration" for configuration details. For bug reporting instructions, please see: <http://www.gnu.org/software/gdb/bugs/>. Find the GDB manual and other documentation resources online at: <http://www.gnu.org/software/gdb/documentation/>. For help, type "help". Type "apropos word" to search for commands related to "word"... Reading symbols from build/blink.elf...done. 0x400d10d8 in esp_vApplicationIdleHook () at /home/user-name/esp/esp-idf/components/esp32s2/./freertos_hooks.c:52 52 asm("waiti 0"); JTAG tap: esp32s2.cpu0 tap/device found: 0x120034e5 (mfg: 0x272 (Tensilica), part: 0x2003, ver: 0x1) JTAG tap: esp32s2.slave tap/device found: 0x120034e5 (mfg: 0x272 (Tensilica), part: 0x2003, ver: 0x1) esp32s2: Debug controller was reset (pwrstat=0x5F, after clear 0x0F). esp32s2: Core was reset (pwrstat=0x5F, after clear 0x0F). Target halted. PRO_CPU: PC=0x5000004B (active) APP_CPU: PC=0x00000000 esp32s2: target state: halted esp32s2: Core was reset (pwrstat=0x1F, after clear 0x0F). Target halted. PRO_CPU: PC=0x40000400 (active) APP_CPU: PC=0x40000400 esp32s2: target state: halted Hardware assisted breakpoint 1 at 0x400db717: file /home/user-name/esp/blink/main/./blink.c, line 43. 0x0: 0x00000000 Target halted. PRO_CPU: PC=0x400DB717 (active) APP_CPU: PC=0x400D10D8 [New Thread 1073428656] [New Thread 1073413708] [New Thread 1073431316] [New Thread 1073410672] [New Thread 1073408876] [New Thread 1073432196] [New Thread 1073411552] [Switching to Thread 1073411996] Temporary breakpoint 1, app_main () at /home/user-name/esp/blink/main/./blink.c:43 43 xTaskCreate(&blink_task, "blink_task", 512, NULL, 5, NULL); (gdb)
Note the third line from bottom that shows debugger halting at breakpoint established in gdbinit file at function app_main(). Since the processor is halted, the LED should not be blinking. If this is what you see as well, you are ready to start debugging.
If you are not quite sure how to use GDB, check Command Line example debugging session in section Debugging Examples.
Using idf.py debug targets
It is also possible to execute the described debugging tools conveniently from idf.py. These commands are supported:
idf.py openocd
Runs OpenOCD in a console with configuration defined in the environment or via command line.
It uses default script directory defined as OPENOCD_SCRIPTS environmental variable, which is automatically added
from an Export script (export.sh or export.bat). It is possible to override the script location
using command line argument --openocd-scripts.
As for the JTAG configuration of the current board, please use the environmental variable OPENOCD_COMMANDS
or --openocd-commands command line argument. If none of the above is defined,
OpenOCD is started with -f board/esp32-wrover-kit-3.3v.cfg board definition.
idf.py gdb
Starts the gdb the same way as the Command Line, but generates the initial gdb scripts referring to the current project elf file.
idf.py gdbtui
The same as 2, but starts the gdb with tui argument allowing very simple source code view.
idf.py gdbgui
Starts gdbgui debugger frontend enabling out-of-the-box debugging in a browser window.
It is possible to combine these debugging actions on a single command line allowing convenient
setup of blocking and non-blocking actions in one step. idf.py implements a simple logic to move the background
actions (such as openocd) to the beginning and the interactive ones (such as gdb, monitor) to the end of the action list.
An example of a very useful combination is
idf.py openocd gdbgui monitor
The above command runs OpenOCD in the background, starts gdbgui to open a browser window with active debugger frontend and opens a serial monitor in the active console.