BLE Log Debugging Tool (BLE Log Console)
BLE Log Console is an Espressif PC tool that receives and displays internal BLE logs over UART (on targets that support UHCI) or an SPI Bridge in real time and saves raw data to .bin files. Use it when BLE behavior is abnormal, standard console logs are insufficient for diagnosis, or Espressif technical support requests debug logs.
Before capturing logs, enable BLE Log in the target device firmware and select a transport as described below. Build and flash the firmware, complete the hardware connections, and then start BLE Log Console to receive logs.
Download
Download the latest stable version from the BLE Log Console releases page.
Capture Logs Through an SPI Bridge
Important
SPI Bridge mode requires a dedicated Bridge device. Currently, use an ESP32-P4 development board running the required Bridge firmware. The Bridge and the target device that generates BLE Log must be separate devices.
The SPI Bridge forwards SPI logs from the target device to the PC. It is suitable for higher log traffic.
The connection is as follows:
Target ESP device -> SPI Bridge -> PC
Firmware Configuration
On the target device that generates BLE Log, enable BLE Log and select the SPI Master DMA transport:
CONFIG_BLE_LOG_ENABLED=y
CONFIG_BLE_LOG_PRPH_SPI_MASTER_DMA=y
CONFIG_BLE_LOG_PRPH_SPI_MASTER_DMA_MOSI_IO_NUM=<GPIO>
CONFIG_BLE_LOG_PRPH_SPI_MASTER_DMA_SCLK_IO_NUM=<GPIO>
CONFIG_BLE_LOG_PRPH_SPI_MASTER_DMA_CS_IO_NUM=<GPIO>
According to the configured GPIOs, connect MOSI, SCLK, and CS on the target device to the corresponding pins on the SPI Bridge, and connect the GND pins of both devices. For instructions on obtaining and flashing the SPI Bridge firmware and for detailed pin connections, see the BLE Log Console User Guide.
Start Log Capture
After configuring and flashing the firmware and connecting the hardware:
Start BLE Log Console.
Select a transport described above and the corresponding port.
Set the log directory, and then connect the device.
After a successful connection, the tool displays parsed BLE Log in real time and saves the raw logs to .bin files. If the received data and frame counts continue to increase and the transfer rate is not zero, log capture is generally working correctly. To end the recording, select Stop & Review or press q / Ctrl+C. The tool flushes buffered data and then shows the quality report.
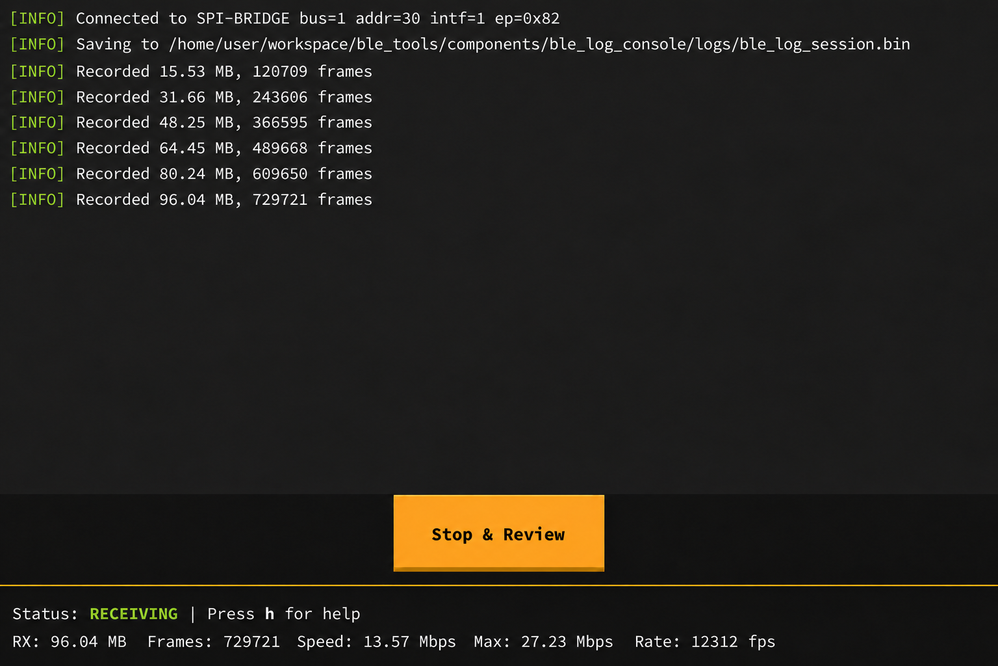
BLE Log Console recording screen
Further Help
For supported operating systems, UI and CLI instructions, recording files, and troubleshooting, see the BLE Log Console User Guide.
If the examples on this page do not fit your project, or you cannot determine the transport and wiring, see the BLE Log Configuration Guide. If you still need help, contact Espressif technical support with the target chip, ESP-IDF version, and relevant configuration.