GDBStub Debugging
You can now use the GDBStub debugging in the Eclipse plugin to diagnose and debug chip issues when the chip enters panic mode.
To enable GDBStub debugging for a project:
Launch the
sdkconfigfile in the project root by double-clicking it. This will open the configuration editor.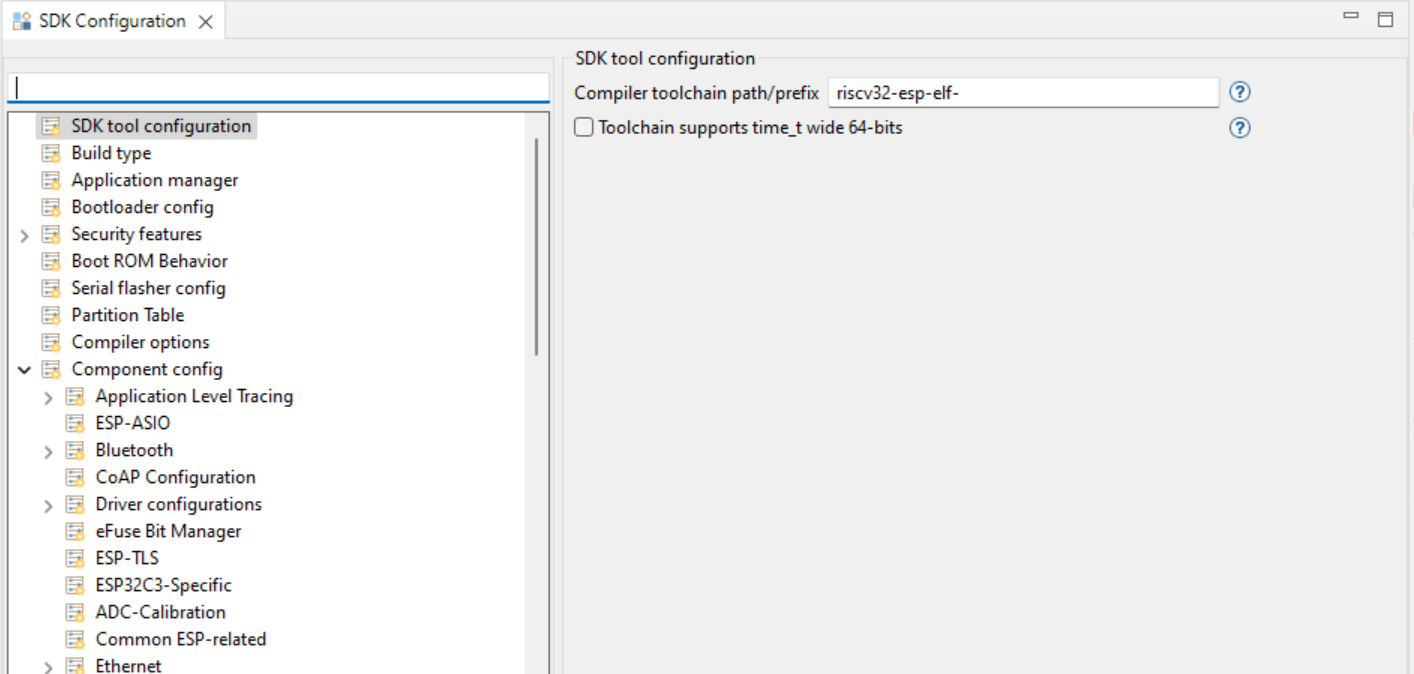
Expand the
Component Configsection and selectESP System Settings. From the settings on the right forPanic handler behaviourselect theGDBStub on panicoption from the list.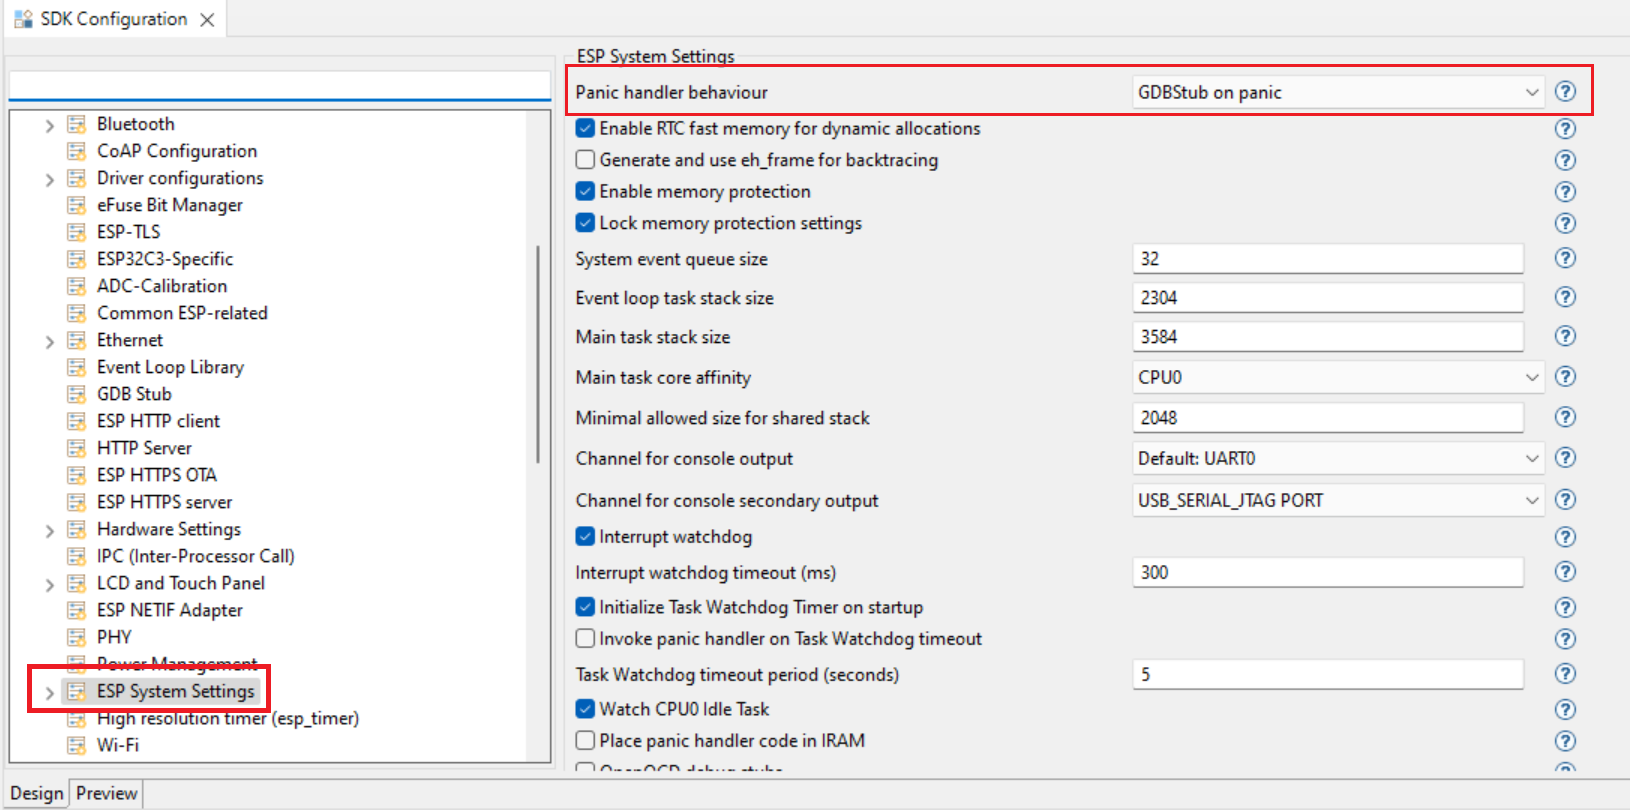
When you connect the serial monitor and a panic occurs in this example, the GDBStub debugger will be launched automatically.
To use the GDBStub debugging for a project:
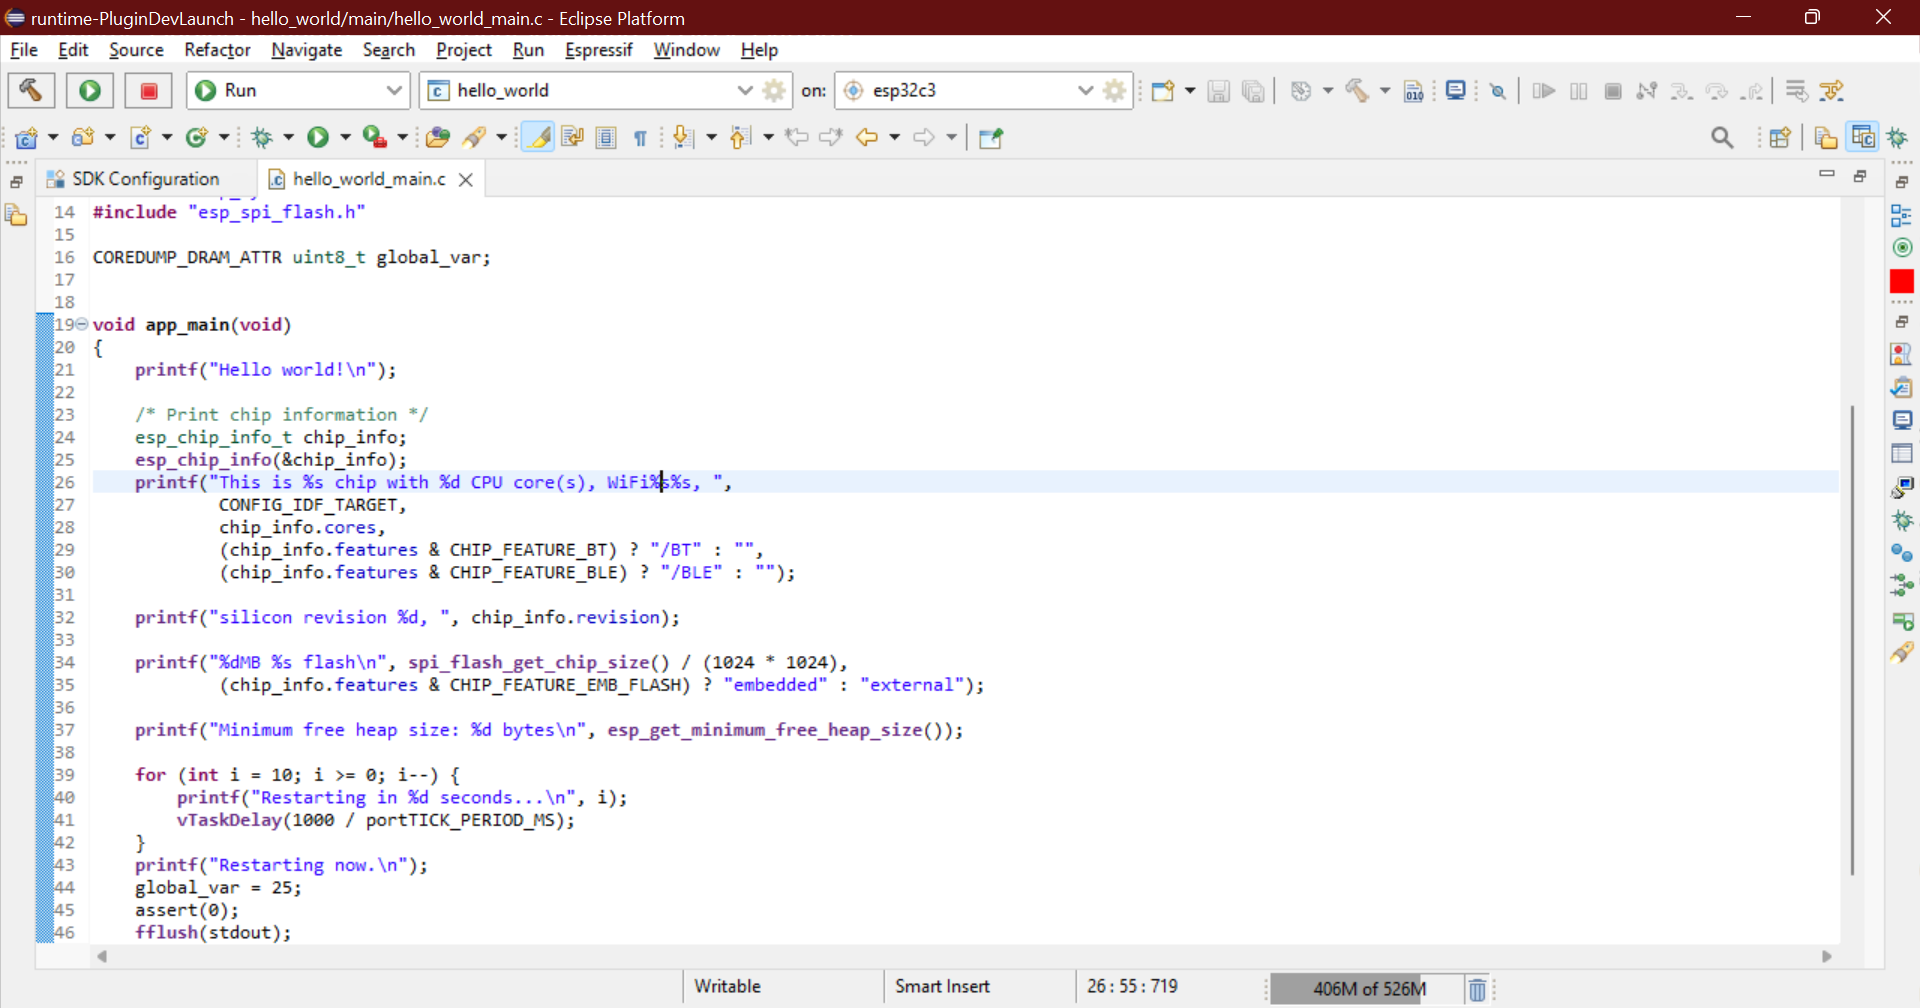
Create a template
hello_worldproject and add the following lines in themain.cfile:// This is a global variable COREDUMP_DRAM_ATTR uint8_t global_var;
Now add these two lines just above the
esp_restart()function:global_var = 25; assert(0);
The final file should look like the following:
Build and flash the project, then launch the serial monitor. At line 45, a failing assert is triggered, which puts the chip into panic mode. When execution reaches this line, you will be prompted to switch to the Debug perspective, and the chip will be halted.
The chip is in panic mode, and execution cannot continue from this point. You must stop and restart the chip using IDF commands or by restarting the serial monitor.
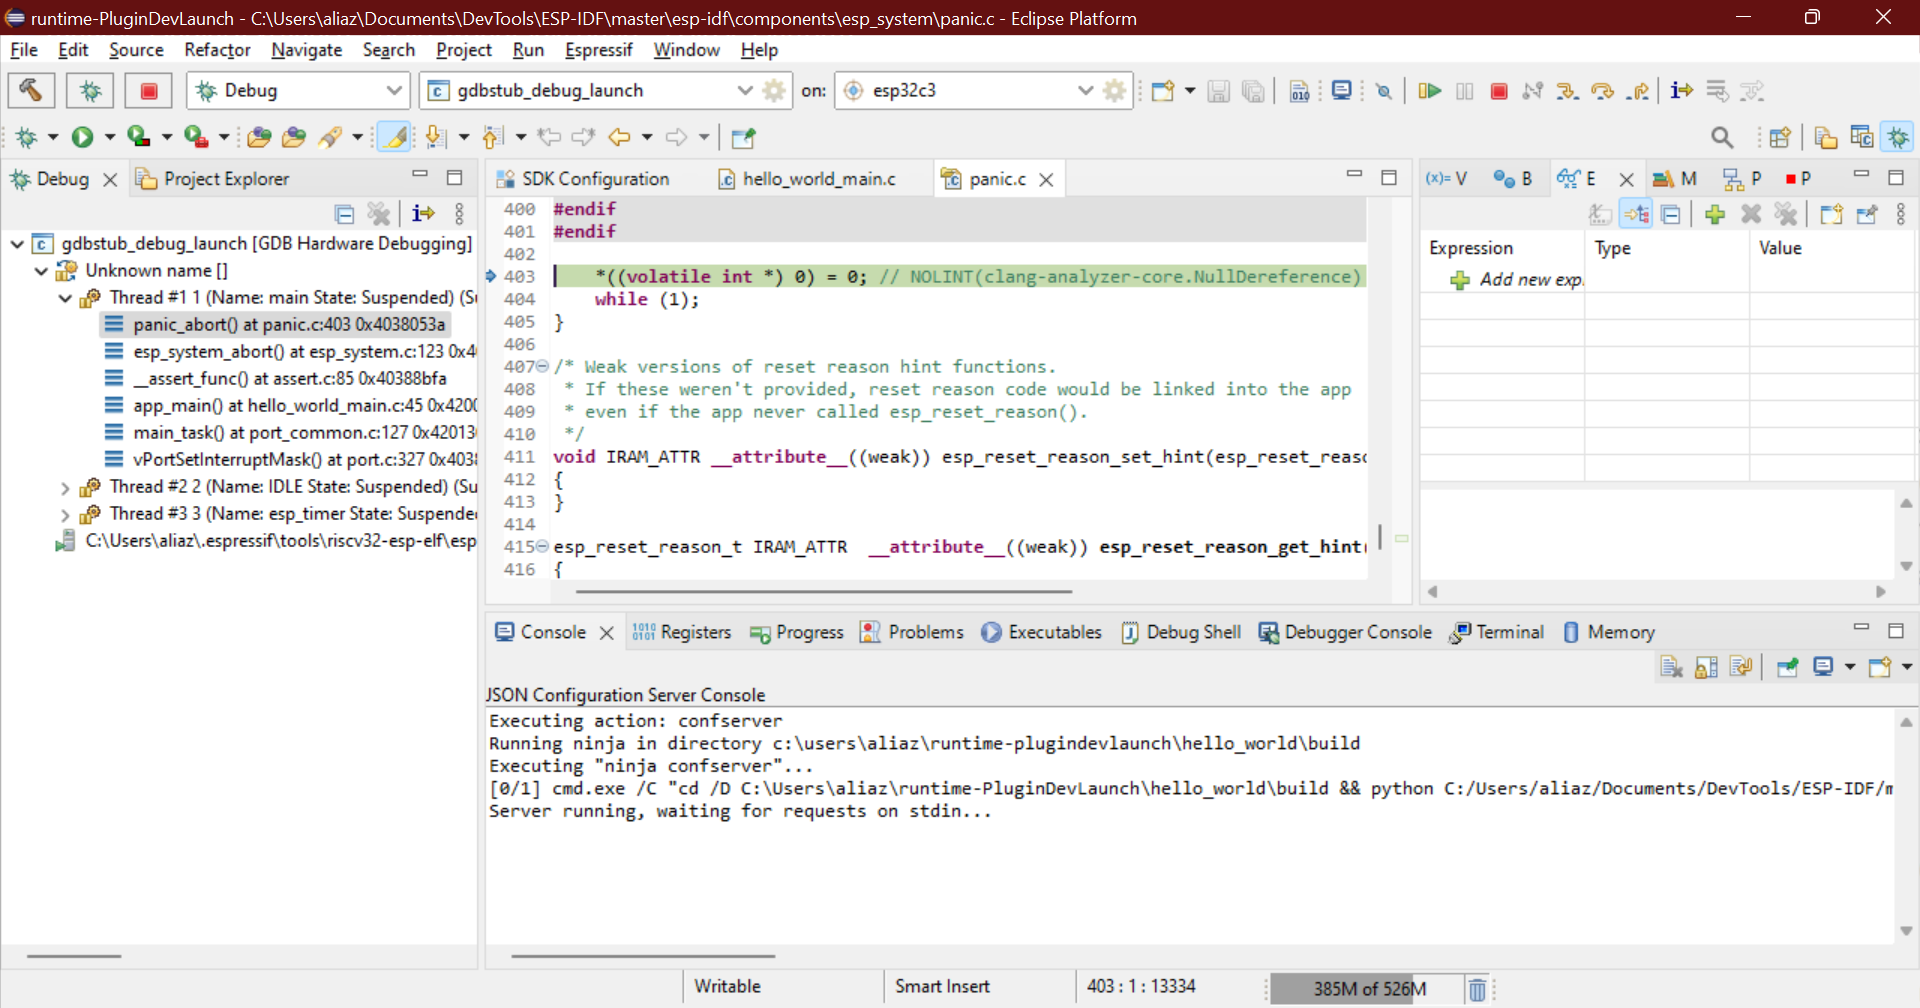
You can view the registers, stack trace, and even the value of variables in the stack frame.
To exit the debug session, simply press the stop button.