Debug Your Project
Table of Contents
Open an ESP-IDF project
First open an ESP-IDF project in Visual Studio Code. You can create a new ESP-IDF project by following the instructions in Create an ESP-IDF Project or open an existing ESP-IDF project.
Note
Please ensure the ESP-IDF project includes a Visual Studio Code debug configuration file (launch.json) in the
<project-dir>/.vscode/launch.jsonfile. If not, you can add the default configuration with theESP-IDF: Add VS Code Configuration Foldercommand (Press F1 and search for the command).
Starting a Debug Session
Before debugging the project, you need to specify the serial port of the device:
Select the serial port
Go to
View>Command PaletteEnter
ESP-IDF: Select Port to Useand choose the command to specify the serial port of your device
Make sure that OpenOCD configuration files are correct
Go to
View>Command PaletteEnter
ESP-IDF: Select OpenOCD Board Configurationand choose the command to specify the OpenOCD configuration files for the extension OpenOCD server
Note
Please review Configuration of OpenOCD for Specific Target to understand which board or configuration to use for your specific hardware.
Make sure to configure your drivers as mentioned in ESP-IDF Configure JTAG Interface documentation.
(Linux users) Copy the OpenOCD udev rules files into the
/etc/udev/rules.ddirectory before running OpenOCD and starting a debug session.
To start debugging, select Run > Start Debugging from the menu or press F5.
You can see the GDB output in the debug console and the OpenOCD output under View > Output by selecting ESP-IDF from the dropdown menu.
The above covers the basic functionality of the ESP-IDF extension. For more information, please refer to Additional IDE Features.
Debugging Process Overview
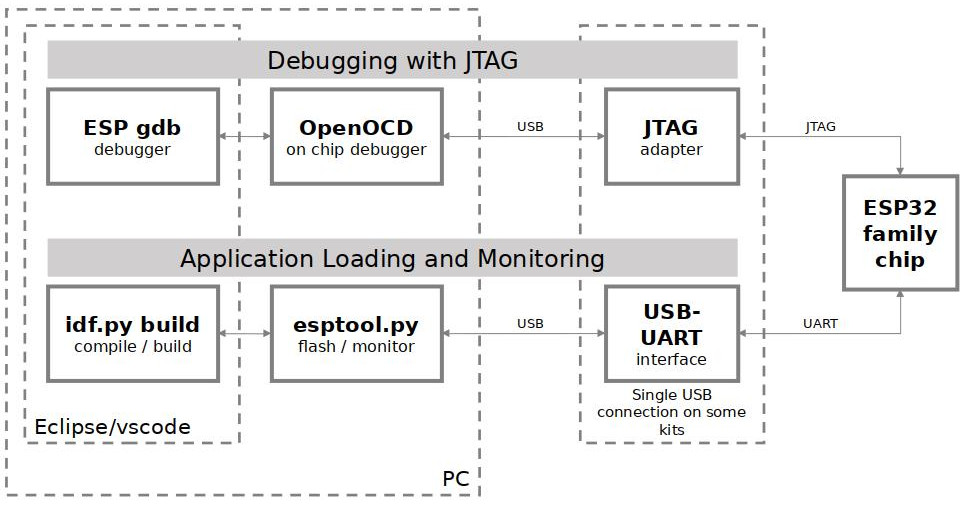
JTAG debugging – overview diagram
First, the OpenOCD server is launched in the background and the output appears under menu
View>Outputby selectingESP-IDFfrom the dropdown menu.By default, the OpenOCD server is launched on localhost, port
4444for Telnet communication, port6666for TCL communication and port3333for GDB. You can change these settings by modifyingopenocd.tcl.hostandopenocd.tcl.portin your<project-directory>/.vscode/settings.json. You can also adjust the verbosity of OpenOCD messages displayed in the ESP-IDF output by settingidf.openOcdDebugLevel. Values from 0 (error messages only) to 4 (Verbose low-level debug message).Next, the Eclipse CDT GDB Adapter is launched in the background, with its output shown in the
Debug Console. This adapter initiates the GDB debug session to connect to the device.This adapter acts as an intermediary between Visual Studio Code, the configured toolchain GDB and the OpenOCD server. Learn more about Espressif chips debugging and how Visual Studio Code uses debug adapters to communicate with various debug tools.
Note
Use idf.openOcdDebugLevel configuration setting to 4 or more to show debug logging in OpenOCD server output.
Use verbose in your
<project-directory>/.vscode/launch.jsonto true to show more debug adapter output.
By default OpenOCD arguments are openocd -d${idf.openOcdDebugLevel} -f ${idf.openOcdConfigs}. If you want to modify them, set idf.openOcdLaunchArgs, an empty array by default, to override the default arguments.
For example, to add -c "init" to the OpenOCD command, set idf.openOcdLaunchArgs in your <project-directory>/.vscode/settings.json as follows:
{
    "idf.openOcdLaunchArgs": [
        "-d${config:idf.openOcdDebugLevel}",
        "${config:idf.openOcdConfigs,-f}"
        "-c",
        "init",
        "-c",
        "reset halt",
    ]
}
In Visual Studio Code select menu View > Output > ESP-IDF. This output information is useful to know what is happening in the extension. For example, OpenOCD communication is displayed in this output.
Using a Custom OpenOCD Path
By default the extension will use the OpenOCD installed in the ESP-IDF IDF_TOOLS_PATH directory. If you want to use a custom OpenOCD, you can set idf.customOpenOCDPath in your <project-directory>/.vscode/settings.json. If this setting is empty or points to a path that does not exist, the extension will fallback to searching OpenOCD in PATH.
{
    "idf.customOpenOCDPath": "/path/to/your/openocd"
}
Setting a Custom Application Image Offset
If you modify the application image offset, you need to update OpenOCD launch arguments accordingly. This is necessary if the OpenOCD output (Menu View > Output > ESP-IDF) shows an error like:
Failed to get flash maps (-6)!
❌ Error: Failed to get flash maps (-6)!
Warn : Application image is invalid! Check configured binary flash offset 'appimage_offset'.
To update OpenOCD launch arguments, open the project’s .vscode/settings.json and add or modify:
{
    "idf.openOcdLaunchArgs": [
        "-d${config:idf.openOcdDebugLevel}",
        "${config:idf.openOcdConfigs,-f}"
        "-c",
        "init",
        "-c",
        "reset halt",
        "-c",
        "esp appimage_offset 0x20000"
    ]
}
where 0x20000 is your application image offset used in the partition table.
Debugging Configuration
To configure the debugging session, open the project’s .vscode/launch.json file. This file contains the configuration for the debug session. The default configuration is as follows:
{
    "configurations": [
        {
            "type": "gdbtarget",
            "request": "attach",
            "name": "Eclipse CDT GDB Adapter"
        }
    ]
}
You can modify the configuration to suit your needs. Let’s describe the configuration options:
type: The type of the debug configuration. It should be set togdbtarget.program: ELF file of your project build directory to execute the debug session. You can use the command${command:espIdf.getProjectName}to query the extension to find the current build directory project name.initCommands: GDB Commands to initialize GDB and target. The default value is["set remote hardware-watchpoint-limit IDF_TARGET_CPU_WATCHPOINT_NUM", "mon reset halt", "maintenance flush register-cache"].initialBreakpoint: WheninitCommandsis not defined, this command will add to defaultinitCommandsa hardware breakpoint at the given function name. For example app_main, the default value, will addthb app_mainto default initCommmands. If set to “”, an empty string, no initial breakpoint will be set and if let undefined it will use the default thb app_main.gdb: GDB executable to be used. By default “${command:espIdf.getToolchainGdb}” will query the extension to find the ESP-IDF toolchain GDB for the current IDF_TARGET of your esp-idf project (esp32, esp32c6, etc.).
Note
IDF_TARGET_CPU_WATCHPOINT_NUM is resolved by the extension according to the current IDF_TARGET of your esp-idf project (esp32, esp32c6, etc.).
Some additional arguments you might use are:
buildFlashMonitor: (Default: false). Build, flash and launch IDF Monitor before starting the debug session. Useidf.monitorDelayto set a delay, in milliseconds, after starting the monitor (Default is1000).debugPort: (Default: 43476) The port to launch the Eclipse CDT GDB Debug Adapter server. If not specified, it will use the default value of 43476.runOpenOCD: (Default: true). Run extension OpenOCD Server.verifyAppBinBeforeDebug: (Default: false) Verify that current ESP-IDF project binary is the same as binary in chip.logFile: Absolute path to the file to log interaction with gdb. Example: ${workspaceFolder}/gdb.log.verbose: Produce verbose log output.environment: Environment variables to apply to the ESP-IDF Debug Adapter. It will replace global environment variables and environment variables used by the extension.
{
    "environment": {
        "VAR": "Value"
    }
}
imageAndSymbols:
{
    "imageAndSymbols": {
        "symbolFileName": "If specified, a symbol file to load at the given (optional) offset",
        "symbolOffset": "If symbolFileName is specified, the offset used to load",
        "imageFileName": "If specified, an image file to load at the given (optional) offset",
        "imageOffset": "If imageFileName is specified, the offset used to load"
    }
}
target: Configuration for target to be attached. Specifies how to connect to the device to debug. Usually OpenOCD exposes the chip as a remote target on port 3333.
{
    "target": {
        "type": "The kind of target debugging to do. This is passed to -target-select (defaults to remote)",
        "host": "Target host to connect to (defaults to 'localhost', ignored if parameters is set)",
        "port": "Target port to connect to (defaults to value captured by serverPortRegExp, ignored if parameters is set)",
        "parameters": "Target parameters for the type of target. Normally something like localhost:12345. (defaults to `${host}:${port}`)",
        "connectCommands": "Replace all previous parameters to specify an array of commands to establish connection"
    }
}
An example of a modified launch.json file is shown below:
{
    "configurations": [
        {
            "type": "gdbtarget",
            "request": "attach",
            "name": "Eclipse CDT GDB Adapter",
            "program": "${workspaceFolder}/build/${command:espIdf.getProjectName}.elf",
            "initCommands": [
                "set remote hardware-watchpoint-limit IDF_TARGET_CPU_WATCHPOINT_NUM",
                "mon reset halt",
                "maintenance flush register-cache"
            ],
            "gdb": "${command:espIdf.getToolchainGdb}",
            "target": {
                "connectCommands": [
                    "set remotetimeout 20",
                    "-target-select extended-remote localhost:3333"
                ]
            }
        }
    ]
}
While the previous example is explicitly using the default values, it can be customized to suit your needs.
There are other, less used arguments documented in the ESP-IDF VS Code extension’s package.json gdbtarget debugger contribution.
Navigating through the Code, Call Stack and Threads
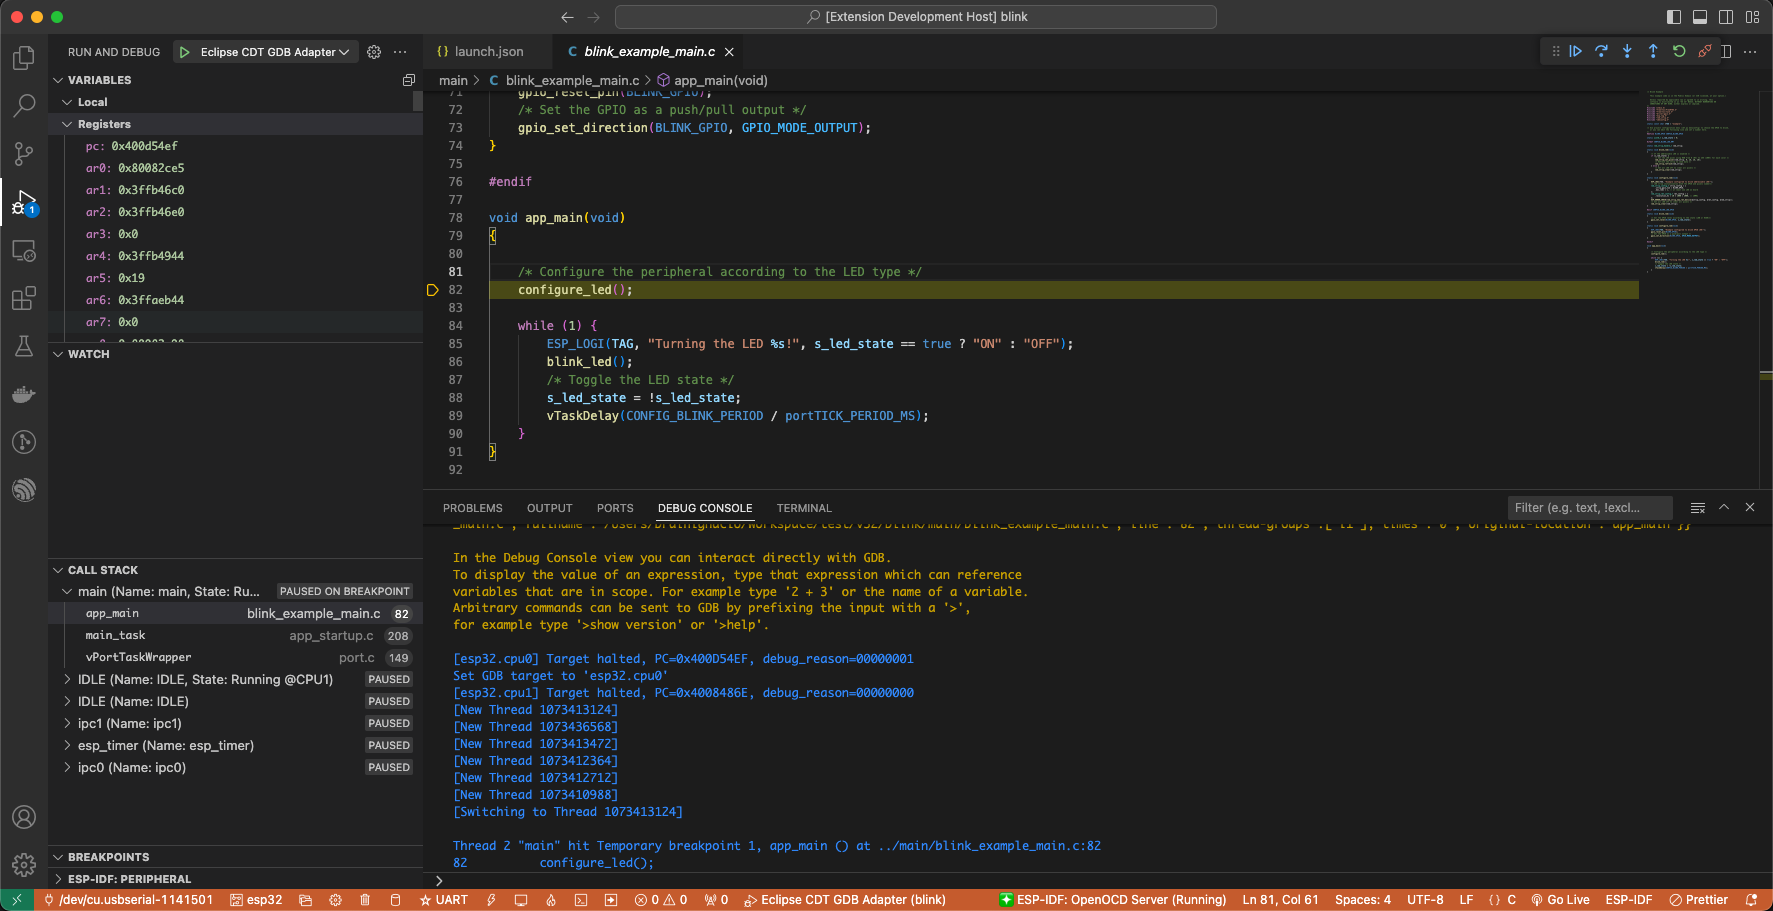
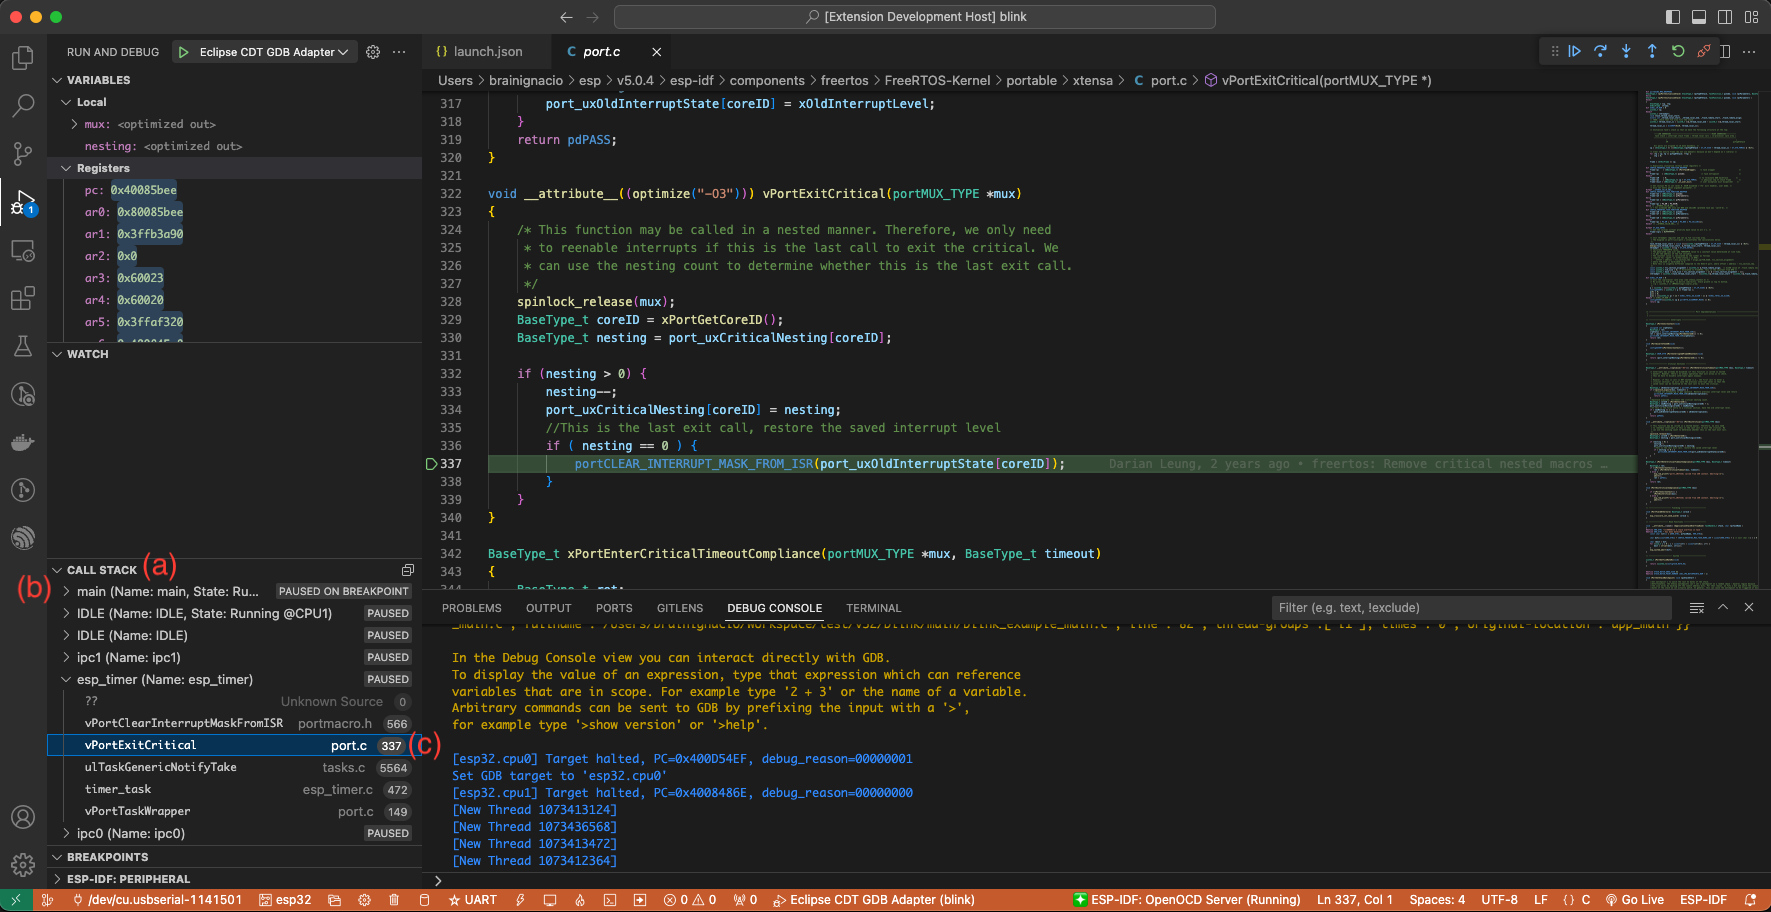
When the target halts, the editor will show the line of code where the program halts and the list of threads in the Call Stack sub-window (a) on the Run icon in the Activity Bar on the side of Visual Studio Code. The first line of call stack under main (b) contains the last called function app_main(), which in turn was called from main_task() as shown in the previous image. Each line of the stack also contains the file name and line number (c) where the function was called. By clicking on each of the stack entries, you will see the file opened.
By expanding threads, you can navigate throughout the application. Some threads contain longer call stacks where you can see, besides function calls, numbers like 0x4000bff0, representing addresses of binary code not provided in source form.
Go back to the app_main() in Thread #1 to familiarize yourself with the code in the blink.c file, which will be examined in more detail in the following examples. Debugger makes it easy to navigate through the code of entire application. This is useful when stepping through the code and working with breakpoints, as will be discussed below.
Setting and Clearing Breakpoints
When debugging, you often need to pause the application at critical points in the code to examine the state of specific variables, memory, registers and peripherals. To achieve this, you can use breakpoints, which provide a convenient way to quickly halt the application at a specific line of code.
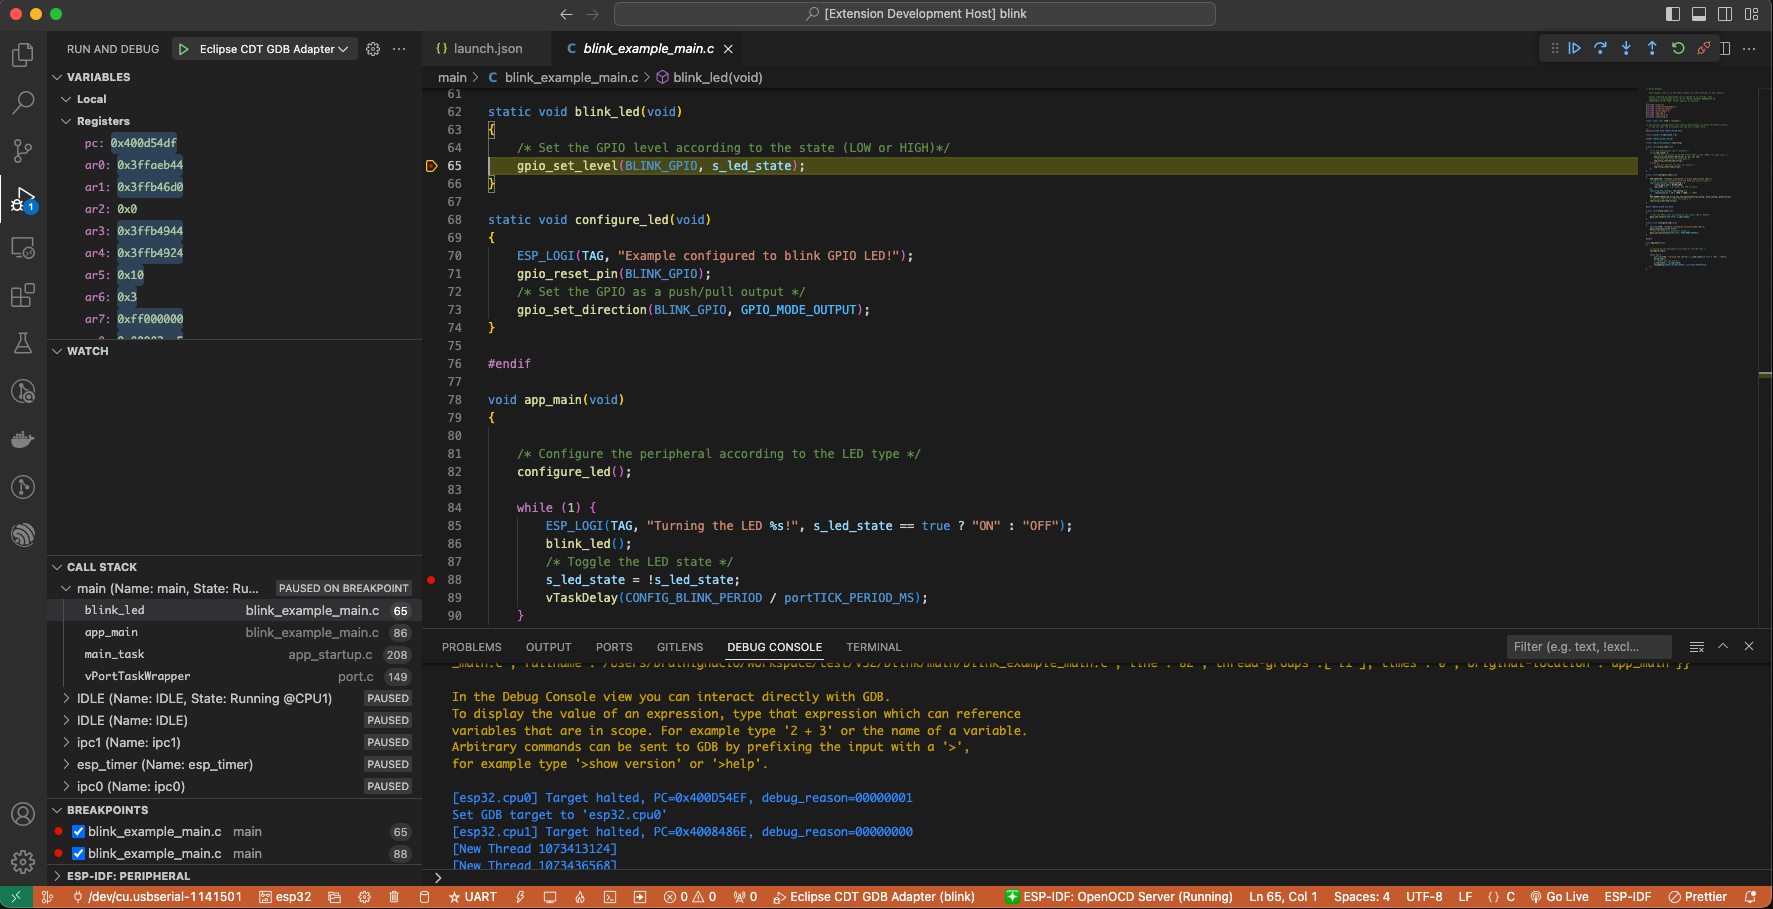
For example, establish two breakpoints where the state of LED changes. Based on the code listing below, this happens at lines 57 and 80. To set a breakpoint, go to the desired line and press F9 or click on the circle shown next to the line number in the editor margin. The list of breakpoints appears in the Breakpoints sub-window under the Run icon in the Activity Bar on the side of Visual Studio Code.
Note
ESP32 supports a maximum of two hardware breakpoints. For more information, refer to Breakpoints and Watchpoints Available.
Once a debug session starts, a debug toolbar will appear on the top of the VS Code editor with several actions, as explained in Visual Studio Code Debug Actions.
Press F5 (Continue/Pause), the processor will run and halt at the next breakpoint. Press F5 again to stop at the next breakpoint, and so on. You can observe that the LED changes the state after each “Continue” command.
Learn more about breakpoints under What Else Should I Know About Breakpoints?.
Halting the Target Manually
When debugging, you may resume the application and enter code that waits for some event or stays in infinite loop without any break points defined. In such cases, to go back to debugging mode, you can break program execution manually by pressing “Continue/Pause” button. To check it, delete all breakpoints and click “Continue”. Then click “Pause”. Application will halt at some random point and the LED will stop blinking.
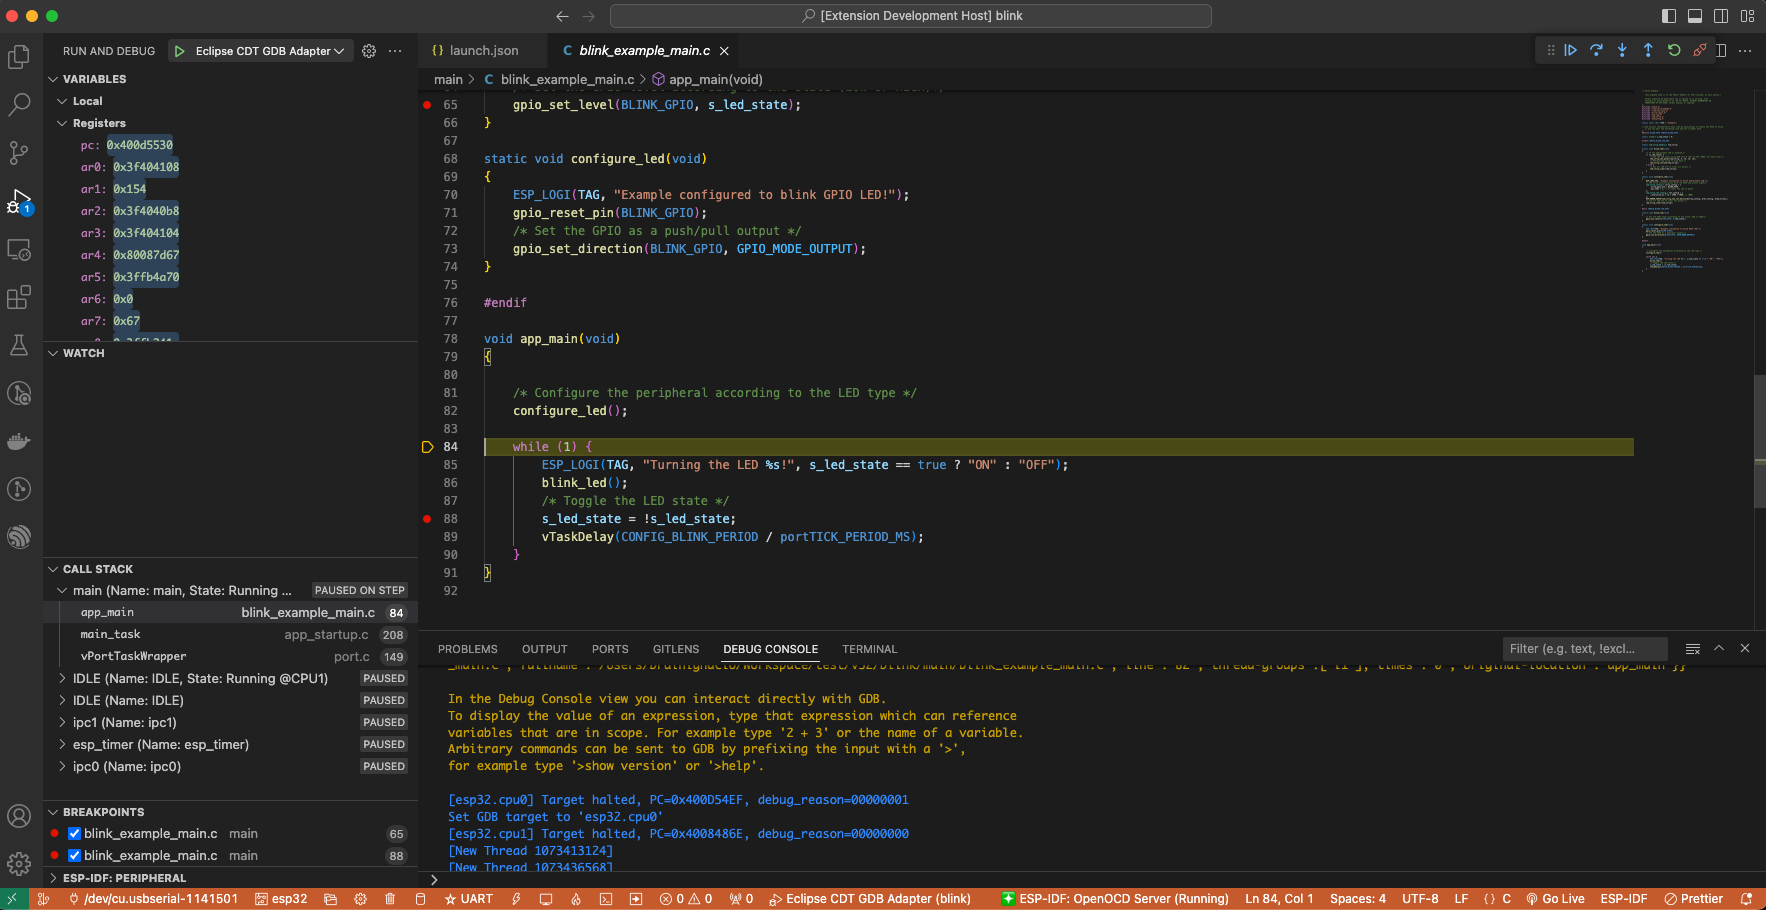
You can also step through the code using the “Step Into (F11)” and “Step Over (F10)” commands. The difference is that “Step Into (F11)” enters inside subroutine calls, while “Step Over (F10)” treats it as a single source line.
Before demonstrating this functionality, make sure that you have only one breakpoint defined at line 57 of blink.c using information discussed in previous paragraphs.
Resume the program by pressing F5 and let it halt. Now press “Step Over (F10)” a few times to see how the debugger steps through the program one line at a time.
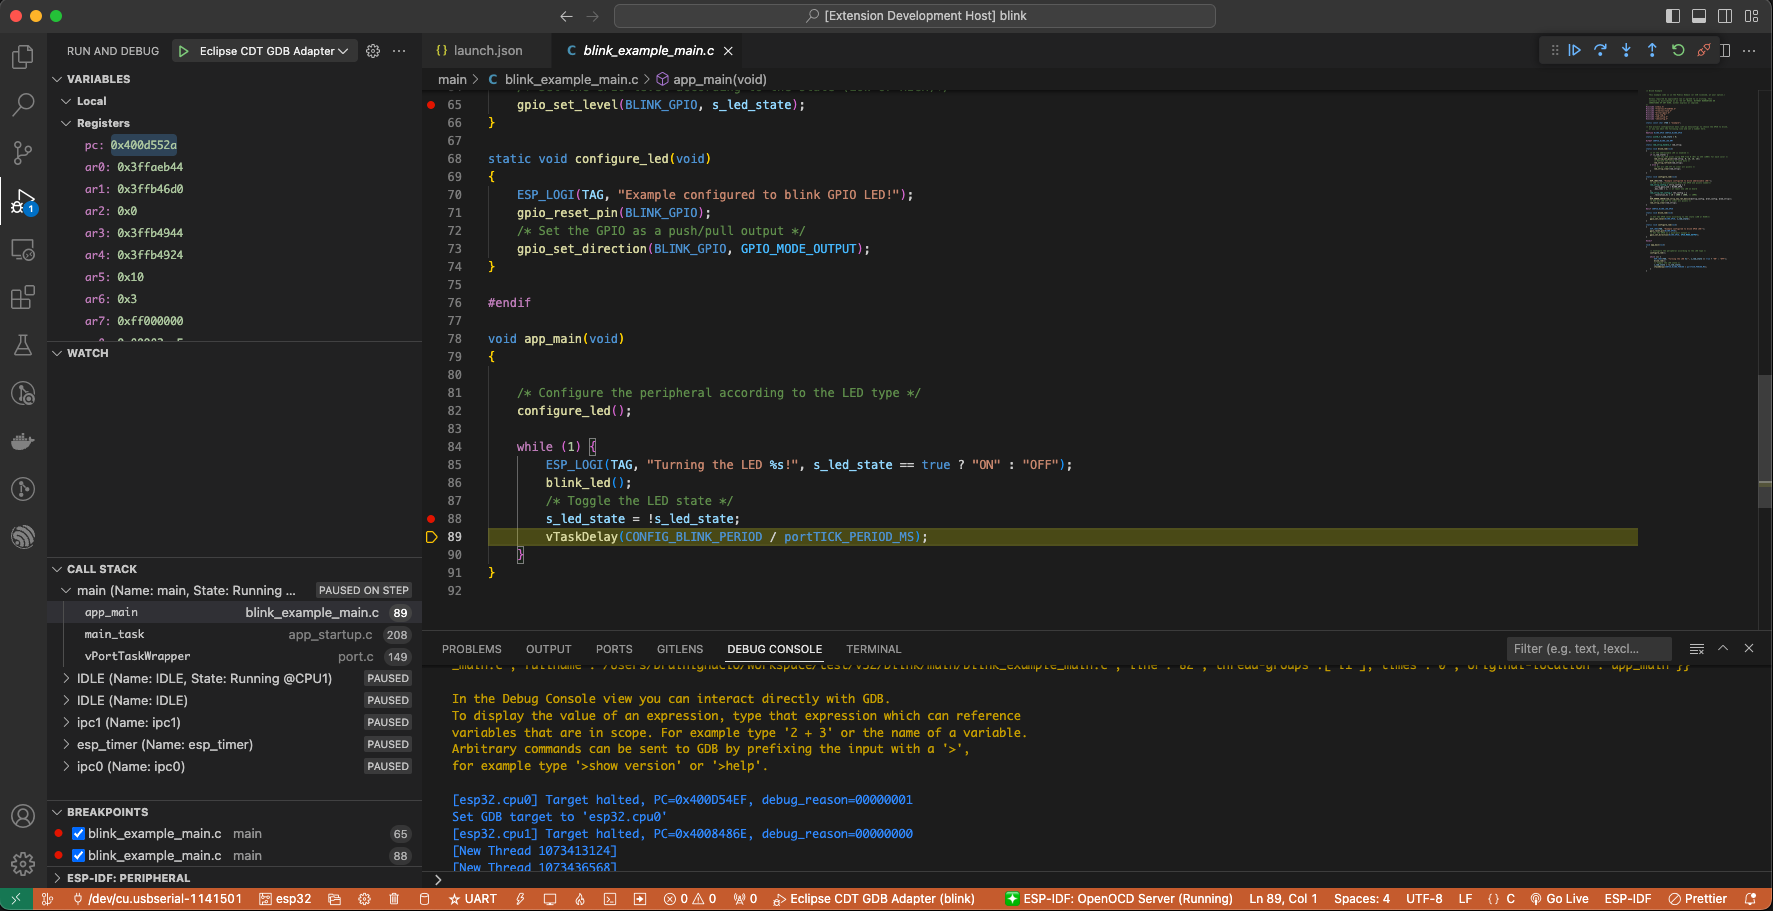
Stepping Through the Code
If you press “Step Into (F11)” instead, then debugger will step inside the subroutine call.
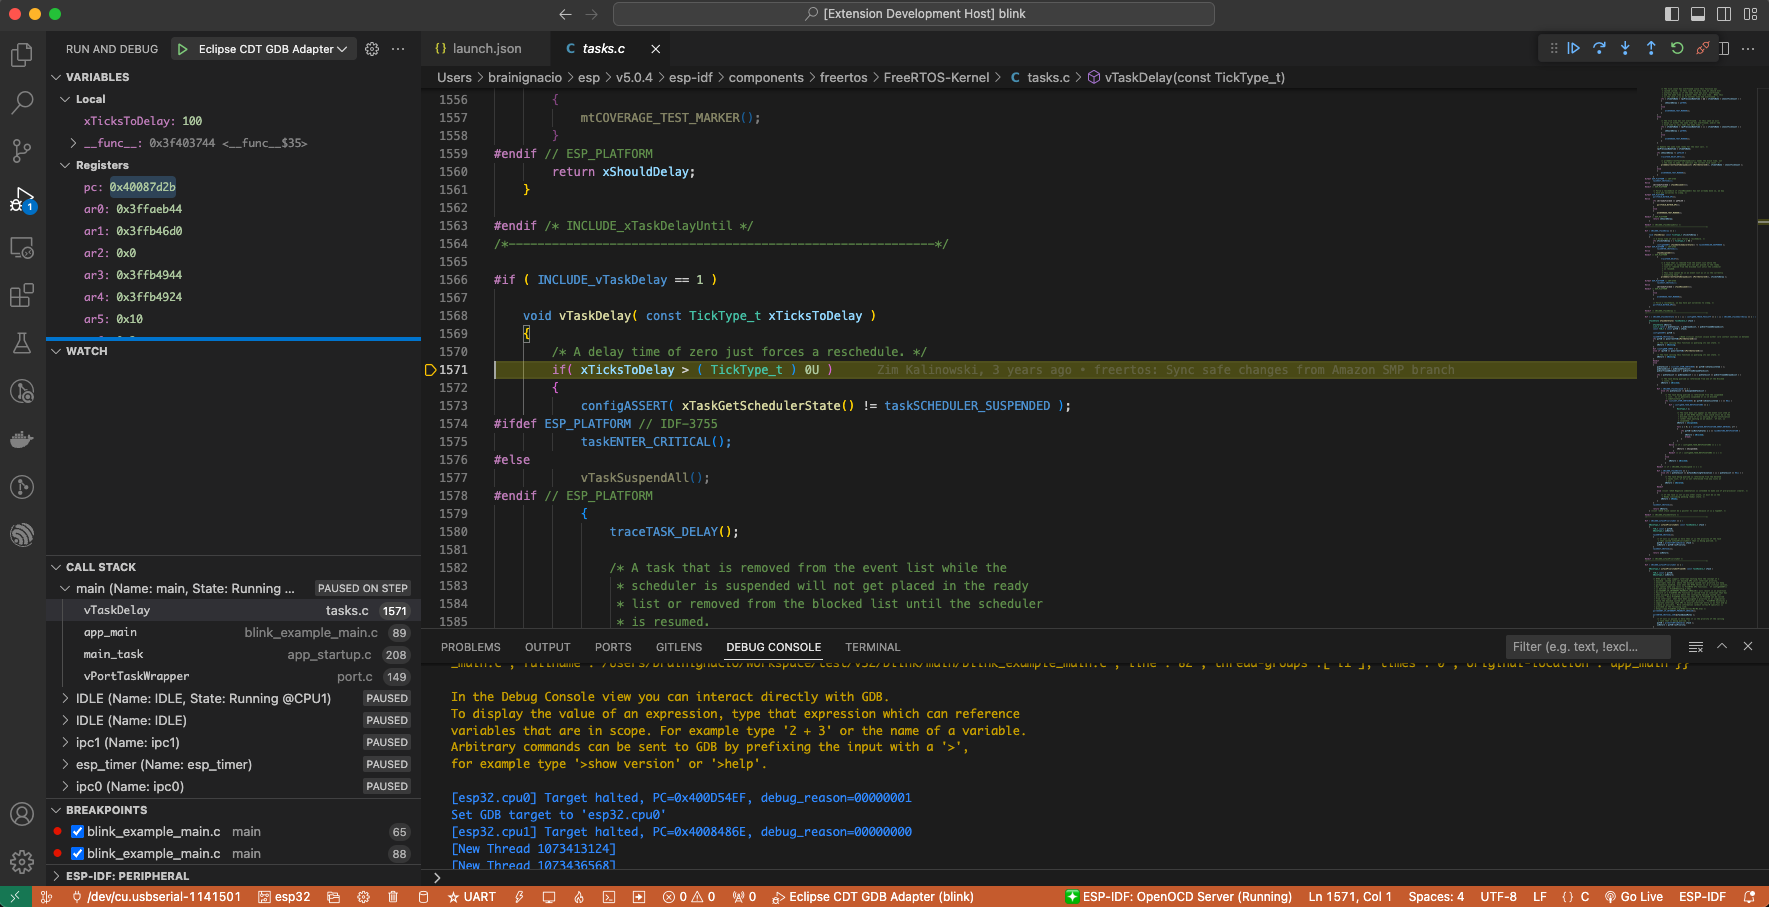
In this case, the debugger steps inside vTaskDelay(CONFIG_BLINK_PERIOD / portTICK_PERIOD_MS) and effectively moves to the tasks.c code.
Note
See Why Stepping with “next” Does Not Bypass Subroutine Calls? for potential limitations using the
nextcommand.
If you press “Step Out (Shift + F11)” instead, then debugger will step outside the subroutine call.
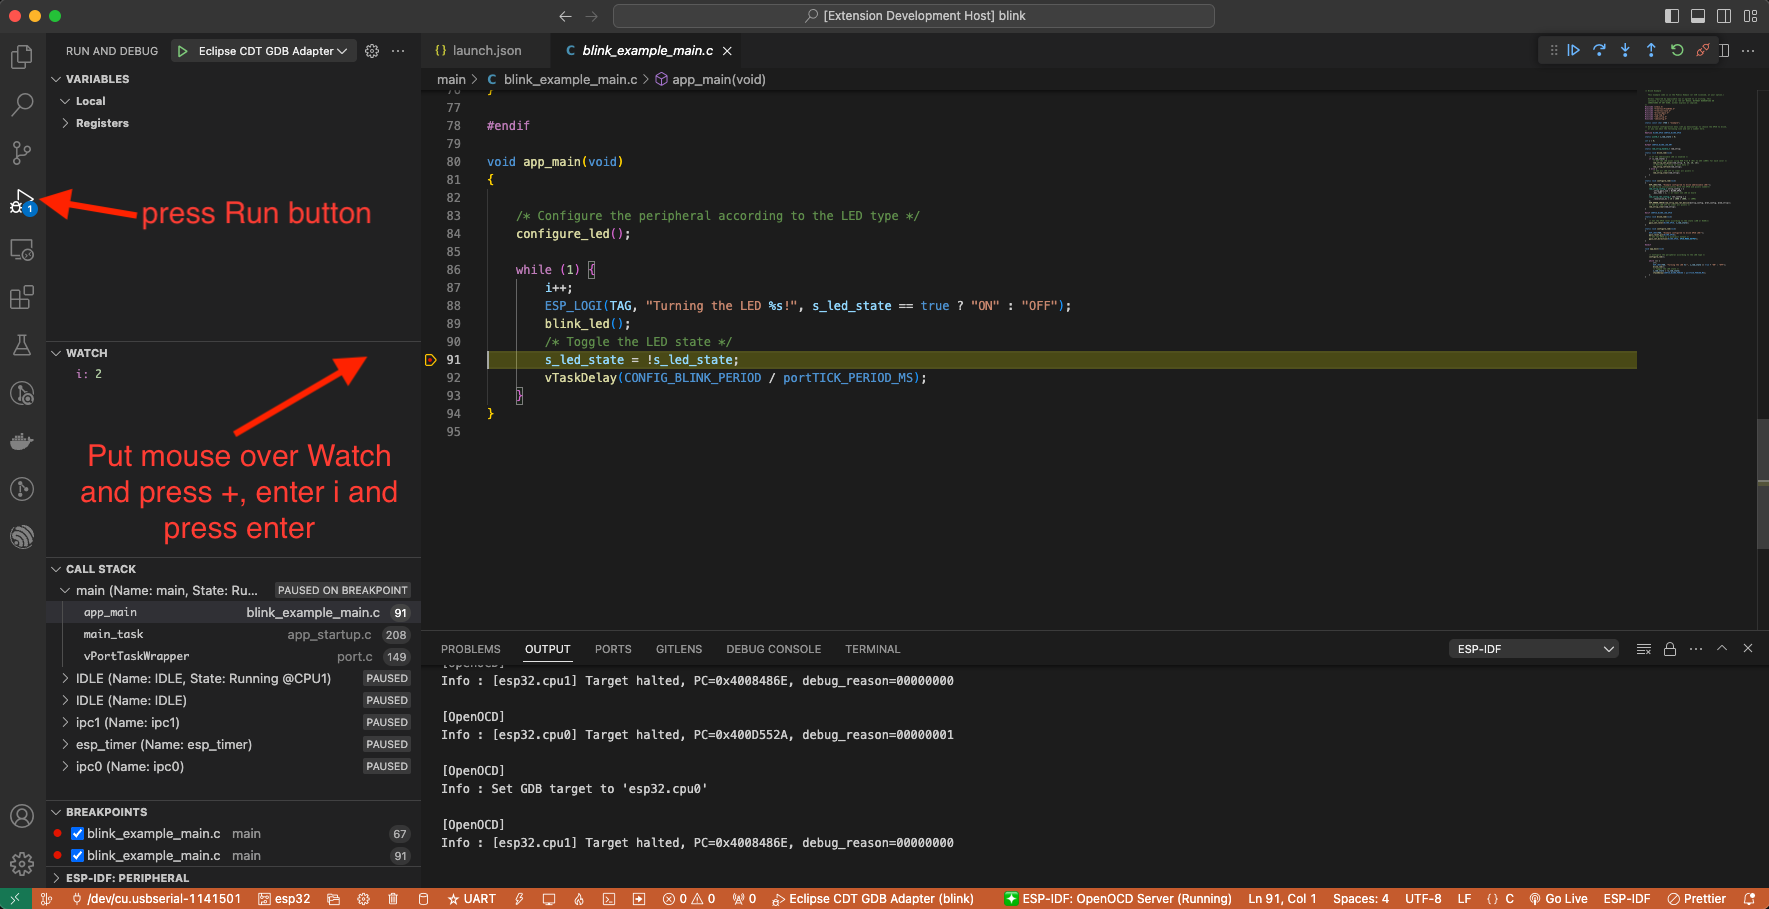
Watching and Setting Program Variables
A common debugging task is checking the value of a program variable as the program runs. To demonstrate this functionality, update file blink.c by declaring a global variable int i above the definition of the function blink_task. Then add i++ inside while(1) of this function to increment i on each blink.
Stop debugging by pressing “Stop (Shift + F5)”. Build and flash the code to the target chip, then restart the debugger by pressing F5. Once the application halts, set a breakpoint on the line where i++ is located.
In the Watch sub-window on the Run icon in the Activity Bar on the side of Visual Studio Code, click the + and enter i to start watching its value.
Resume program execution by pressing F5. Each time the program pauses, the value of i will have incremented.
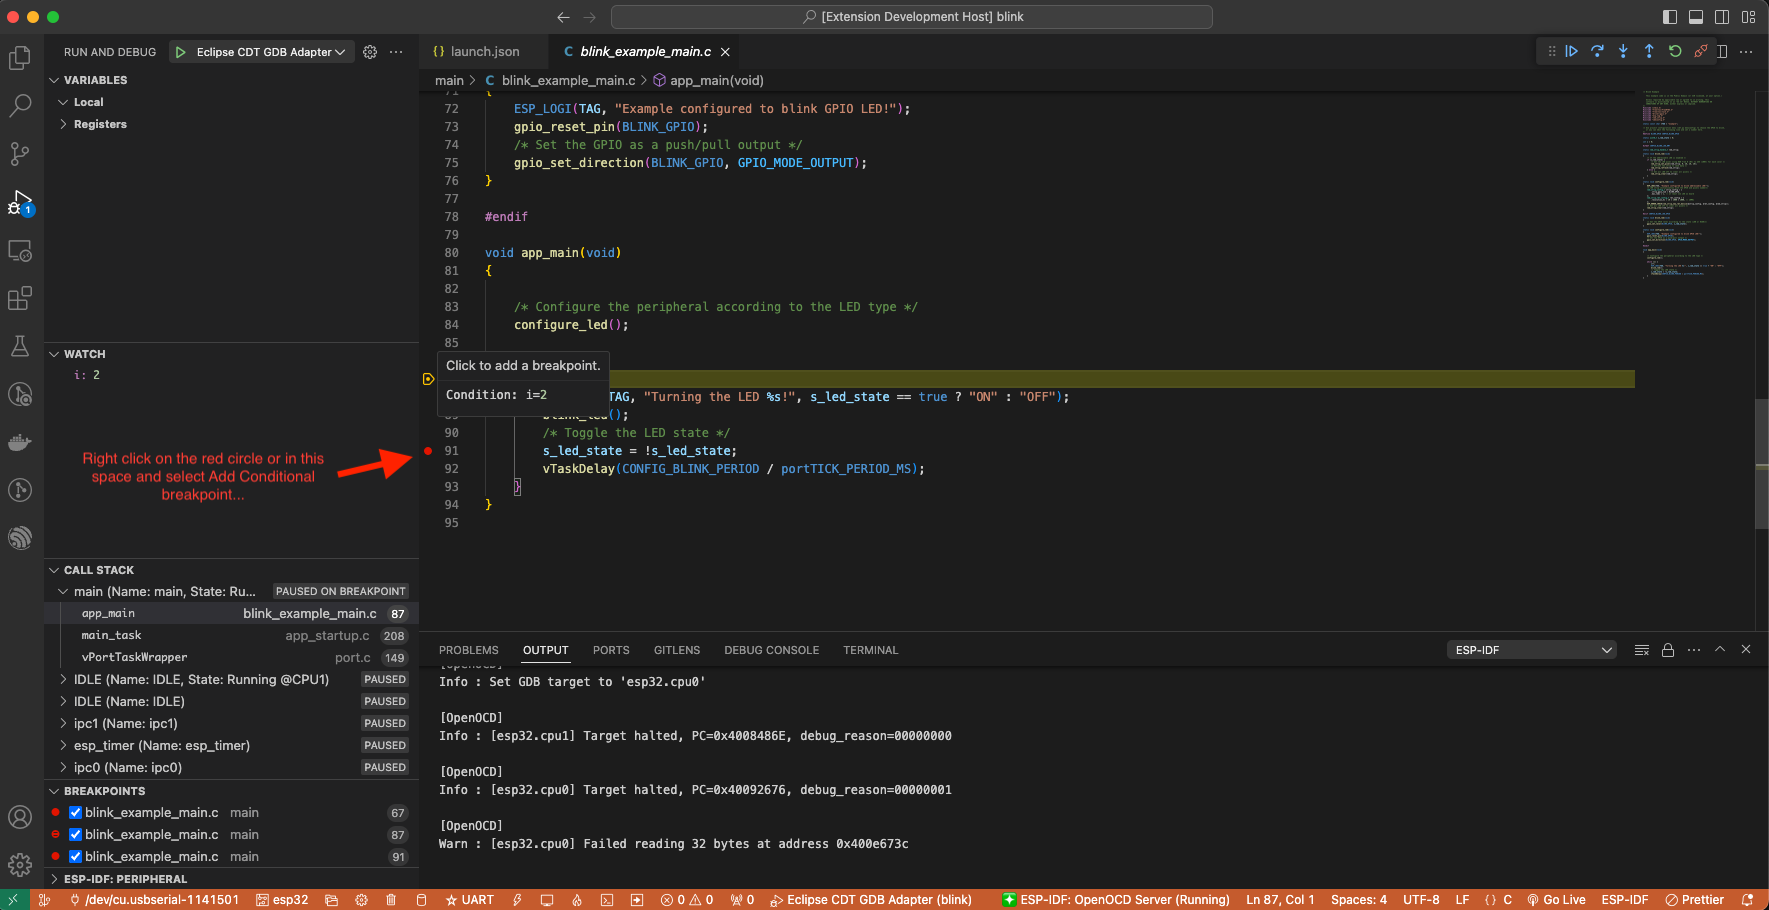
Setting Conditional Breakpoint
You can also set a breakpoint to halt the program execution if a certain condition is satisfied. See Visual Studio Code Conditional Breakpoints.
To set a new conditional breakpoint, go to the desired line, right-click on the circle next to the line number (editor margin), and select Add Conditional Breakpoint action. You can also modify a breakpoint to add a condition in the list of breakpoints in the Breakpoints sub-window on the Run icon in the Activity Bar. Click the pencil icon on the breakpoint and set the breakpoint condition.
For this example, go to line 79, right-click on the circle next to the line number (editor margin), select Add Conditional Breakpoint action, and set i=2. When you start debugging, the debugger will stop on line 79 when i equals 2.
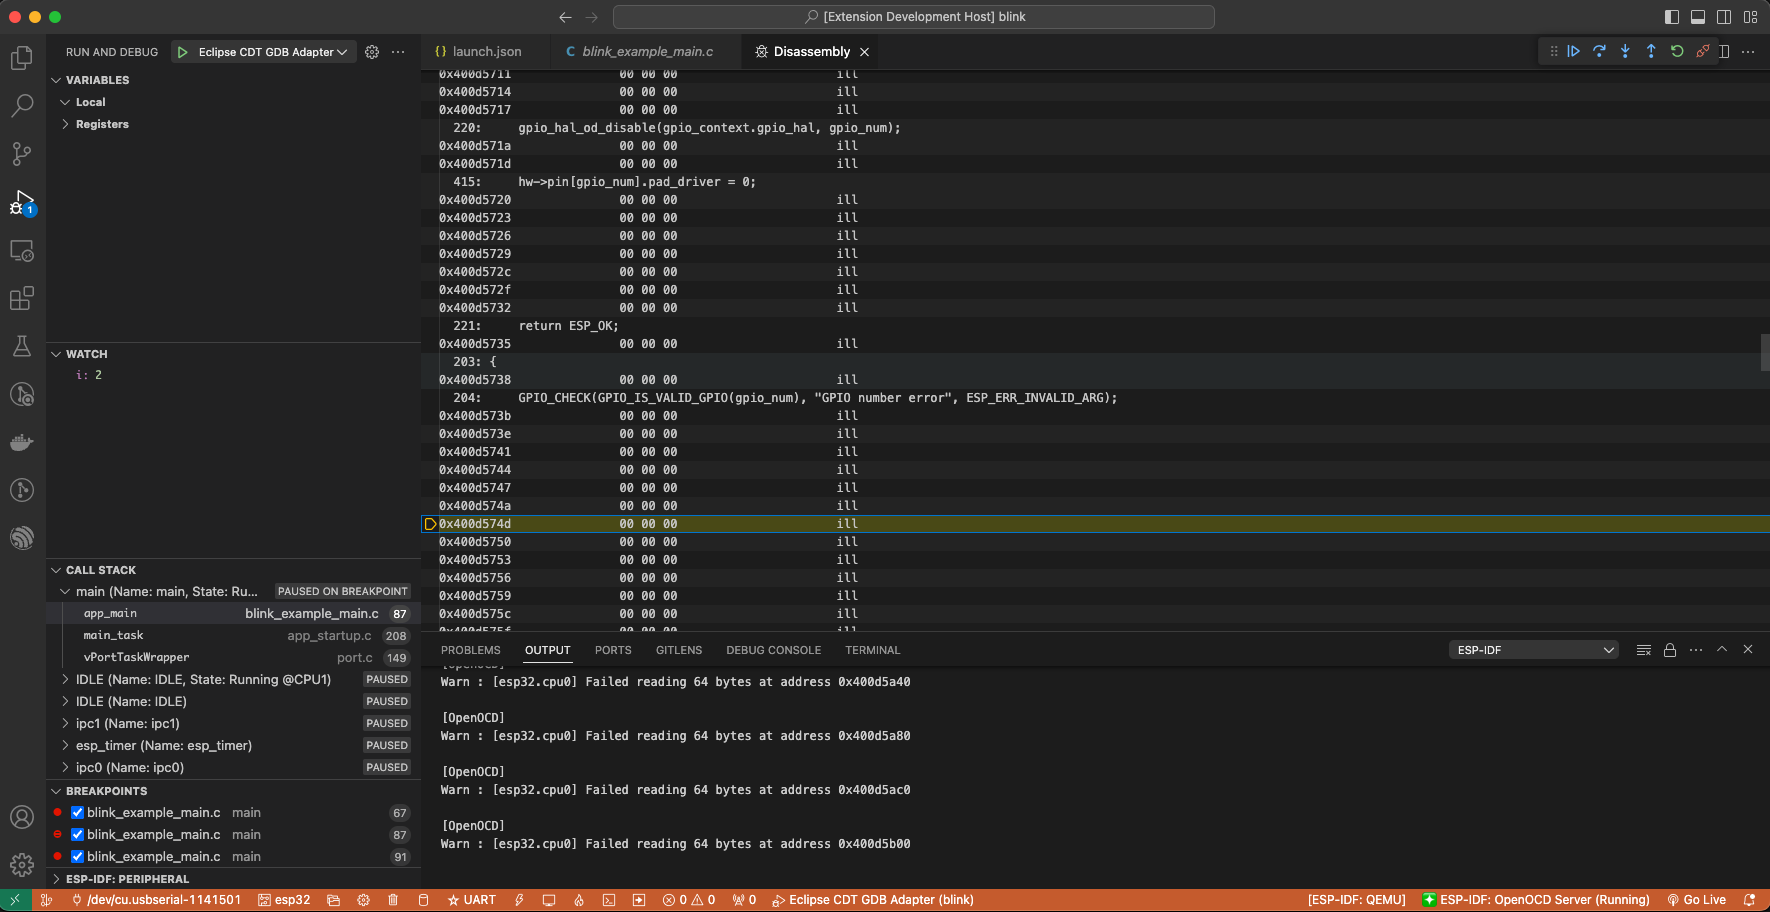
Disassembly View
You can check the assembly code during a debugging session by right-clicking on any line in in a source code file and selecting Open Disassembly View. Disassemble View shows the assembly code with C code, where you can also set breakpoints.
Watchpoints (Data Breakpoints)
See Breakpoints and Watchpoints Available for more information.
Send Commands to GDB
You can send any GDB command in the debug console with > COMMAND. For example, > i threads.
To view binary data variables, click View Binary Data next to the variable name.
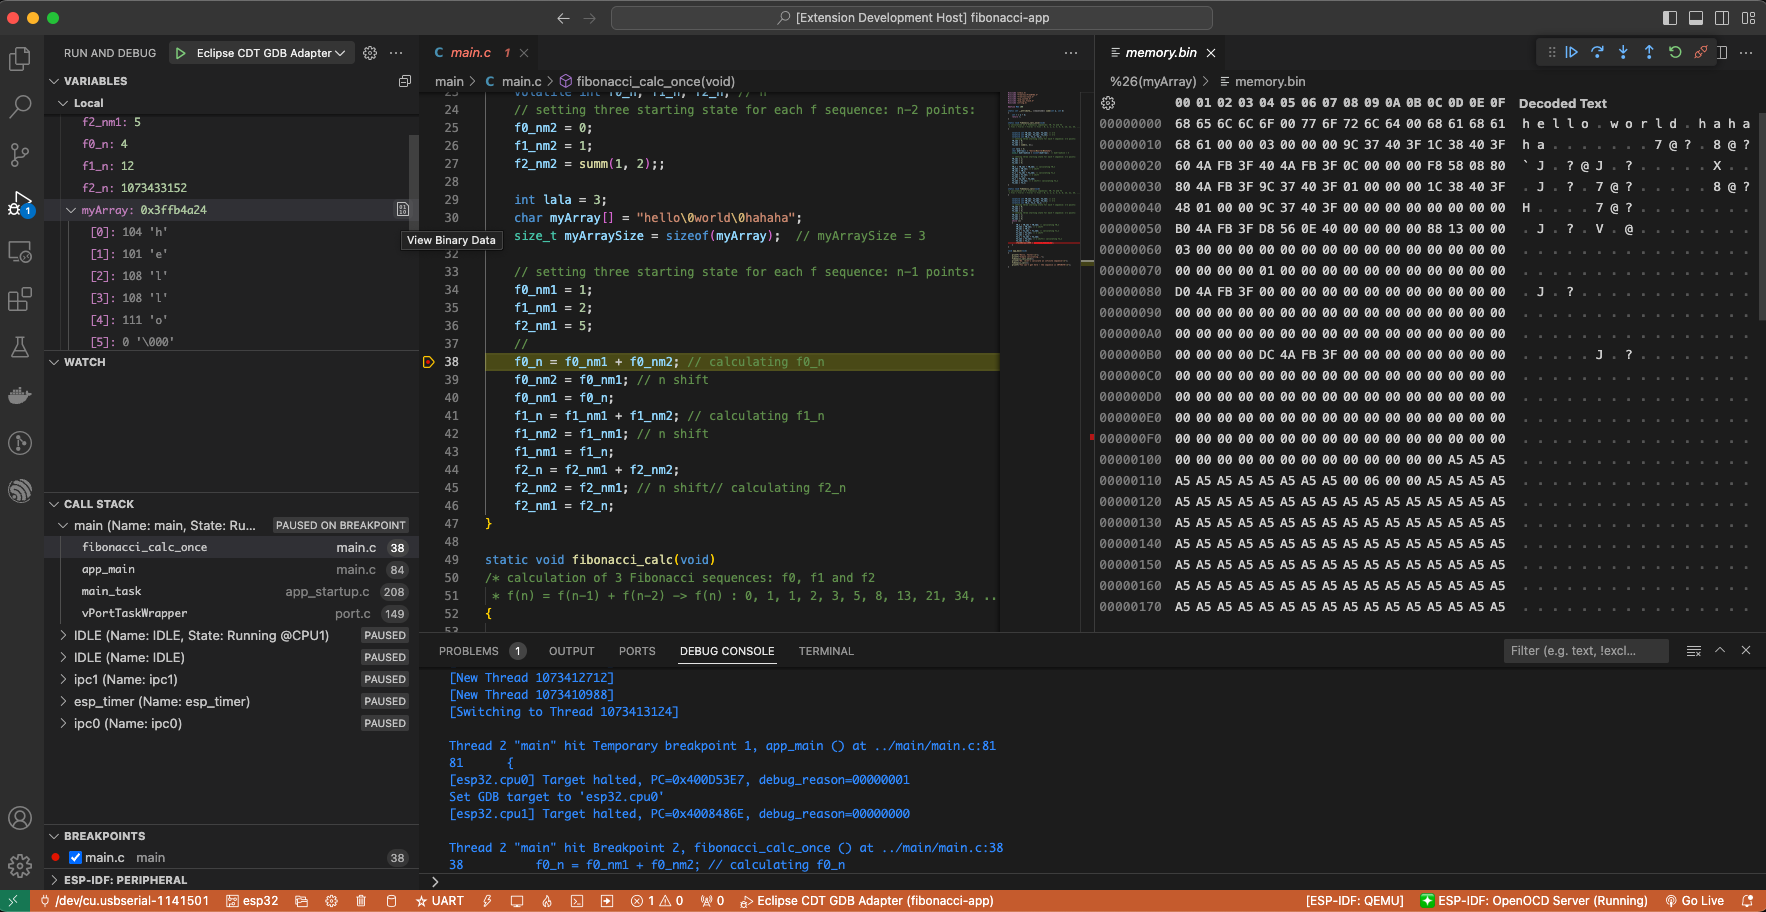
Learn more about Command Line Debugging.
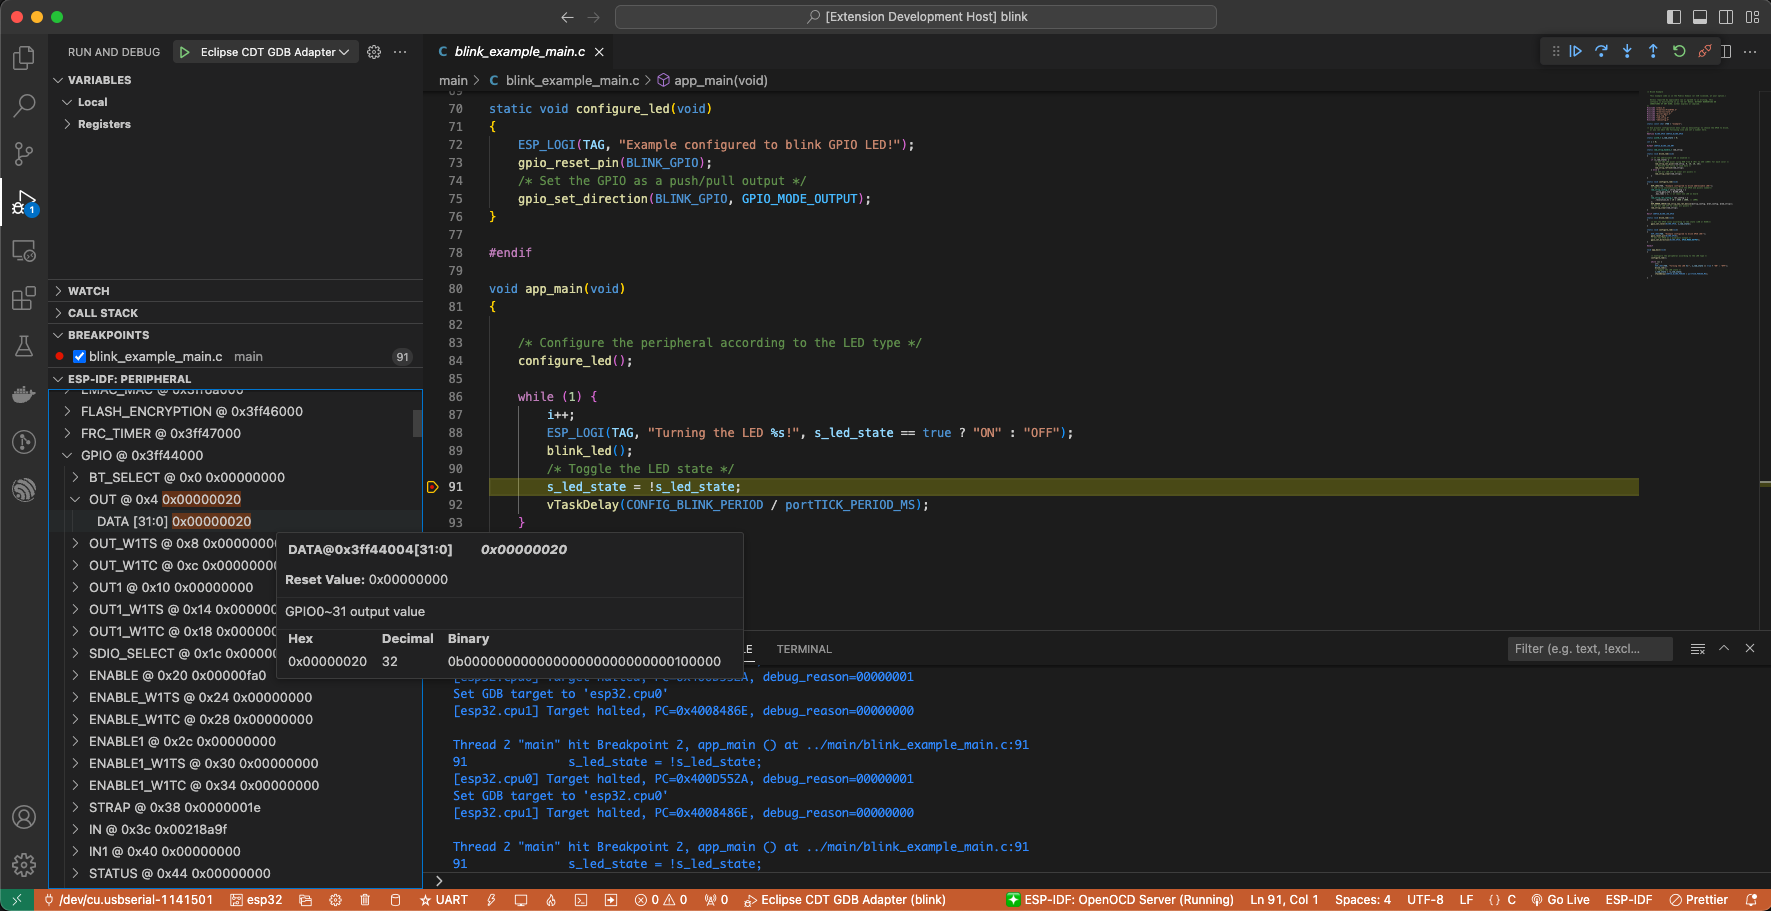
ESP-IDF: Peripheral View
ESP-IDF extension provides an ESP-IDF: Peripheral View tree in the Run and Debug view. This tree view uses the SVD file specified in the IDF SVD File Path (idf.svdFilePath) configuration to populate a set of peripheral register values for the active debug session target. You can download Espressif SVD files from Espressif SVD repository.
Post-mortem Debugging Use Cases
You can start a monitor session to capture fatal error events with ESP-IDF: Launch IDF Monitor for Core Dump Mode/GDB Stub Modec command. If configured in your project’s sdkconfig, it can trigger the start of a debug session for GDB remote protocol server (GDBStub) or ESP-IDF Core Dump when an error occurs. For more information, see Panic Handler.
Core Dump is configured when Core Dump’s Data Destination is set to either
UARTorFLASHusing theESP-IDF: SDK Configuration Editorextension command oridf.py menuconfigin a terminal.GDB Stub is configured when Panic Handler Behaviour is set to
Invoke GDBStubusing theESP-IDF: SDK Configuration Editorextension command oridf.py menuconfigin a terminal.
ESP-IDF: Image Viewer
The ESP-IDF extension provides an ESP-IDF: Image Viewer feature that allows you to visualize binary image data from debug variables during a debugging session. This is particularly useful for applications that work with camera sensors, display buffers, LVGL graphics, OpenCV computer vision, or any raw image data.
Quick Access Methods:
Right-click on variables in the debug session: - Right-click on any image-related variable (
lv_image_dsc_t,cv::Mat,png_image, etc.) and selectView Variable as Image- The Image Viewer automatically detects the variable type and extracts the appropriate image propertiesManual Image Viewer: - Go to
View>Command Paletteand enterESP-IDF: Open Image Viewer- Enter the name of your image data variable and its size - Select the appropriate image format and dimensions - ClickLoad Imageto visualize the data
Supported Image Formats:
The Image Viewer supports a comprehensive range of image formats:
RGB Formats: - RGB565, RGB888, RGBA8888, ARGB8888, XRGB8888 - BGR888, BGRA8888, ABGR8888, XBGR8888 - RGB332, RGB444, RGB555, RGB666, RGB777 - RGB101010, RGB121212, RGB161616
Other Formats: - Grayscale (8-bit per pixel) - YUV420, YUV422, YUV444 (various YUV formats)
Built-in Support:
LVGL Image Descriptor (lv_image_dsc_t): - Automatically extracts format, dimensions, and data from LVGL structures - Supports all LVGL color formats with automatic mapping to display formats
OpenCV Mat (cv::Mat): - Automatically extracts dimensions, format, and data from OpenCV Mat objects - Supports BGR888, BGRA8888, and Grayscale formats
Example Usage:
LVGL Image Example:
// LVGL image descriptor
lv_image_dsc_t my_image = {
    .header = {
        .cf = LV_COLOR_FORMAT_RGB888,  // Color format
        .w = 320,                      // Width
        .h = 240                       // Height
    },
    .data_size = 320 * 240 * 3,        // Data size in bytes
    .data = image_data                 // Pointer to image data
};
During debugging, right-click on my_image and select View Variable as Image. The Image Viewer will automatically detect it as an LVGL image and extract the format, dimensions, and data.
OpenCV Mat Example:
cv::Mat image(240, 320, CV_8UC3);  // 320x240 BGR888 image
// ... populate image data ...
During debugging, right-click on image and select View Variable as Image. The Image Viewer will automatically detect it as an OpenCV Mat and extract the dimensions, format, and data.
Manual Raw Data Example:
uint8_t image_buffer[320 * 240 * 3];  // RGB888 format, 320x240 pixels
size_t image_size = sizeof(image_buffer);
For manual usage:
- Enter image_buffer as the variable name
- Enter image_size or 230400 (320 * 240 * 3) as the size
- Select RGB888 format
- Set width to 320 and height to 240
Custom Image Format Configuration:
You can extend the Image Viewer to support custom image formats by creating a JSON configuration file and setting the idf.imageViewerConfigs configuration option.
Example Custom Configuration:
[
  {
    "name": "Custom Image Structure",
    "typePattern": "my_image_t",
    "width": {
      "type": "string",
      "isChild": true,
      "value": "w"
    },
    "height": {
      "type": "string",
      "isChild": true,
      "value": "h"
    },
    "format": {
      "type": "number",
      "isChild": false,
      "value": "0x0E"
    },
    "dataAddress": {
      "type": "string",
      "isChild": true,
      "value": "pixels"
    },
    "dataSize": {
      "type": "formula",
      "isChild": false,
      "value": "$var.w * $var.h * 3"
    },
    "imageFormats": {
      "14": "rgb888",
      "15": "rgba8888"
    }
  }
]
Configuration Options:
typePattern: Regex pattern to match the GDB type of the selected variable when right-clicking “View Variable as Image” (e.g.,
"my_image_t","lv_image_dsc_t","cv::Mat|Mat")width/height: Configuration for extracting image dimensions
format: Configuration for extracting image format
dataAddress: Configuration for extracting image data pointer
dataSize: Configuration for calculating image data size (supports formulas)
imageFormats: Mapping of numeric format values to display format strings
Field Configuration Details:
Each field (width, height, format, dataAddress, dataSize) has the following properties:
type: Specifies the data type of the field value: -
"string": The value is a string (field name or expression) -"number": The value is a numeric constant (e.g.,"0x0E","14") -"formula": The value is a mathematical formula (only for dataSize field)isChild: Determines how the field value is interpreted: -
true: The value represents a child field of the right-clicked variable (e.g.,"header.w","data") -false: The value is a direct expression or constant that can be evaluated by GDBvalue: The actual field name, expression, or constant to use for extraction
Important Configuration Notes:
dataSize Formula: When using formulas in the
dataSizefield, the string$varwill be automatically replaced with the actual variable name when you right-click and select “View Variable as Image”. For example, if your variable is namedmy_imageand the formula is$var.w * $var.h * 3, it will be evaluated asmy_image.w * my_image.h * 3. Note: The formula must be a valid GDB expression since it is calculated by GDB itself.Format Number Mapping: The numeric keys in the
imageFormatsobject must match the actual numeric values that theformatfield extracts from your image structure. For example, if your image structure’s format field contains the value14, then theimageFormatsobject should have a key"14"that maps to the appropriate display format string like"rgb888".
Important Notes:
- Automatic Detection: The Image Viewer automatically detects supported image types and extracts properties
- Unified Interface: Single View Variable as Image command works for all supported formats
- Format Validation: All formats are validated against supported display formats
- Raw Data: The Image Viewer supports raw pixel formats. Compressed formats (JPEG, PNG, etc.) are not supported
- Size Specification: For manual usage, you must specify the correct size of the image data array
- Variable Size: The size can be provided as a number (bytes) or as the name of another variable containing the size
- Pointer Variables: For pointer variables, make sure to provide the actual data size, not the pointer size
- Auto-Dimensioning: The Image Viewer automatically estimates dimensions based on the data size and selected format, but you can manually adjust them for better results
- Extensible: Custom image formats can be added through configuration files
Other extensions debug configuration
While we support the ESP-IDF extension, you can also use other extensions to debug your project. For example, you can use the Microsoft C/C++ extension to debug your project.
To do this, you need to configure the launch.json file in the .vscode directory of your project. Here is an example of a launch.json file:
{
  "configurations": [
      {
      "name": "GDB",
      "type": "cppdbg",
      "request": "launch",
      "MIMode": "gdb",
      "miDebuggerPath": "${command:espIdf.getToolchainGdb}",
      "miDebuggerServerAddress": "localhost:3333",
      "program": "${workspaceFolder}/build/${command:espIdf.getProjectName}.elf",
      "windows": {
          "program": "${workspaceFolder}\\build\\${command:espIdf.getProjectName}.elf"
      },
      "cwd": "${workspaceFolder}",
      "environment": [
          {
          "name": "KEY",
          "value": "VALUE"
          }
      ],
      "setupCommands": [
          {
          "text": "set remotetimeout 20"
          }
      ],
      "postRemoteConnectCommands": [
          {
          "text": "mon reset halt"
          },
          {
          "text": "maintenance flush register-cache"
          }
      ],
      "externalConsole": false,
      "logging": {
          "engineLogging": true
      }
      }
  ]
}
Another recommended debug extension is the Native Debug extension. Here is an example configuration for the launch.json file:
{
    "configurations": [
        {
            "type": "gdb",
            "request": "attach",
            "name": "NativeDebug",
            "target": "extended-remote :3333",
            "executable": "${workspaceFolder}/build/${command:espIdf.getProjectName}.elf",
            "gdbpath": "${command:espIdf.getToolchainGdb}",
            "cwd": "${workspaceRoot}",
            "autorun": [
                "mon reset halt",
                "maintenance flush register-cache",
                "thb app_main"
            ]
        }
    ]
}
Consider that if you use these extension debugger configuration you need to manually run OpenOCD from ESP-IDF VS Code extension [OpenOCD] status bar button or from terminal.