Using Debugger
This section covers the steps to configure and run a debugger using various methods, including:
For how to run a debugger from VS Code, see Configuration for Visual Studio Code Debug.
Eclipse
Note
It is recommended to first check if debugger works using Idf.py Debug Targets or from Command Line and then move to using Eclipse.
Eclipse is an integrated development environment (IDE) that provides a powerful set of tools for developing and debugging software applications. For ESP-IDF applications, IDF Eclipse plugin provides two ways of debugging:
GDB Hardware Debugging
By default, Eclipse supports OpenOCD Debugging via the GDB Hardware Debugging plugin, which requires starting the OpenOCD server from the command line and configuring the GDB client from Eclipse to start with the debugging. This approach can be time-consuming and error-prone.
To make the debugging process easier, the IDF Eclipse plugin has a customized ESP-IDF GDB OpenOCD Debugging functionality. This functionality supports configuring the OpenOCD server and GDB client from within Eclipse. All the required configuration parameters will be pre-filled by the plugin, and you can start debugging with just a click of a button.
Therefore, it is recommended to use the ESP-IDF GDB OpenOCD Debugging via the IDF Eclipse plugin.
GDB Hardware Debugging
Note
This approach is recommended only if you are unable to debug using ESP-IDF GDB OpenOCD Debugging for some reason.
To install the GDB Hardware Debugging plugin, open Eclipse and select Help > Install New Software.
After installation is complete, follow these steps to configure the debugging session. Please note that some configuration parameters are generic, while others are project-specific. This will be shown below by configuring debugging for "blink" example project. If not done already, add this project to Eclipse workspace following Eclipse Plugin. The source of get-started/blink application is available in examples directory of ESP-IDF repository.
In Eclipse, go to
Run>Debug Configuration. A new window will open. In the left pane of the window, double-clickGDB Hardware Debugging(or selectGDB Hardware Debuggingand press theNewbutton) to create a new configuration.In a form that will show up on the right, enter the
Name:of this configuration, e.g., "Blink checking".On the
Maintab below, underProject:, press theBrowsebutton and select theblinkproject.In the next line under
C/C++ Application:, press theBrowsebutton and select theblink.elffile. Ifblink.elfis not there, it is likely that this project has not been built yet. Refer to the Eclipse Plugin for instructions.Finally, under
Build (if required) before launchingclickDisable auto build.A sample window with settings entered in points 1 - 5 is shown below.
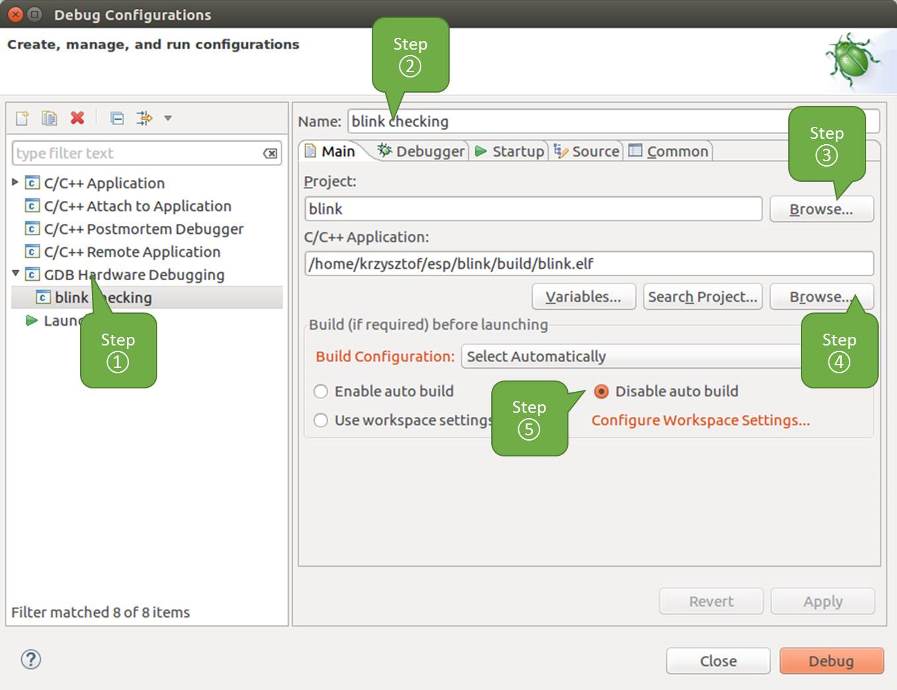
Configuration of GDB Hardware Debugging - Main tab
Click the
Debuggertab. In fieldGDB Command, enterxtensa-esp32-elf-gdbto invoke the debugger.Change the default configuration of the
Remote hostby entering3333under thePort number.Configuration entered in points 6 and 7 is shown on the following picture.
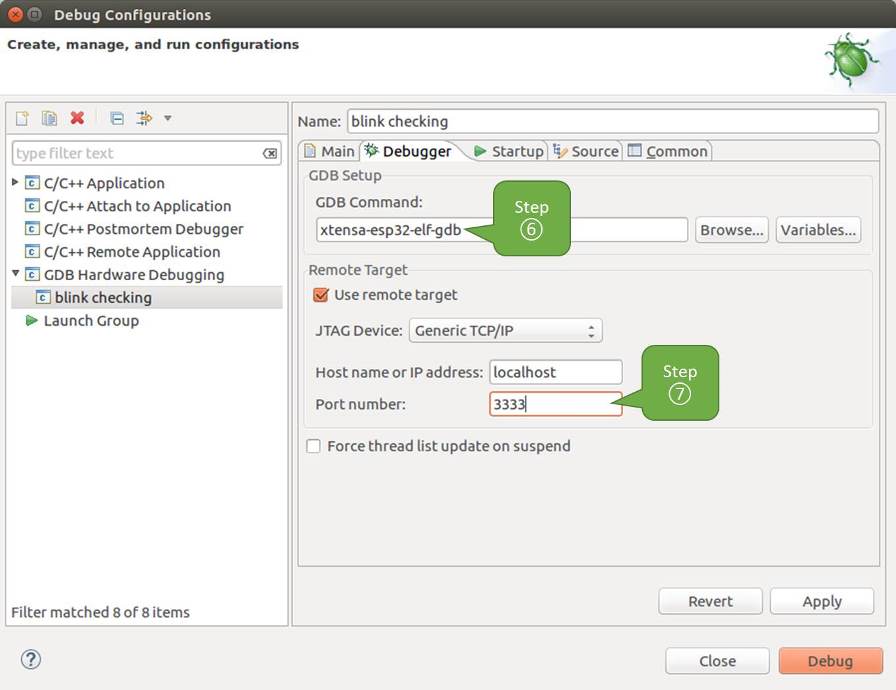
Configuration of GDB Hardware Debugging - Debugger tab
The last tab that requires changing the default configuration is
Startup. UnderInitialization CommandsuncheckReset and Delay (seconds)andHalt. Then, in the entry field below, enter the following lines:mon reset halt maintenance flush register-cache set remote hardware-watchpoint-limit 2
Note
To automatically update the image in the flash before starting a new debug session, add the following command lines to the beginning of the
Initialization Commandstextbox:mon reset halt mon program_esp ${workspace_loc:blink/build/blink.bin} 0x10000 verifyFor description of
program_espcommand, see Upload Application for Debugging.Uncheck the
Load imageoption underLoad Image and Symbols.Further down on the same tab, establish an initial breakpoint to halt CPUs after they are reset by debugger. The plugin will set this breakpoint at the beginning of the function entered under
Set break point at:. Checkout this option and enterapp_mainin provided field.Checkout
Resumeoption. This will make the program to resume aftermon reset haltis invoked per point 8. The program will then stop at breakpoint inserted atapp_main.Configuration described in points 8 - 11 is shown below.
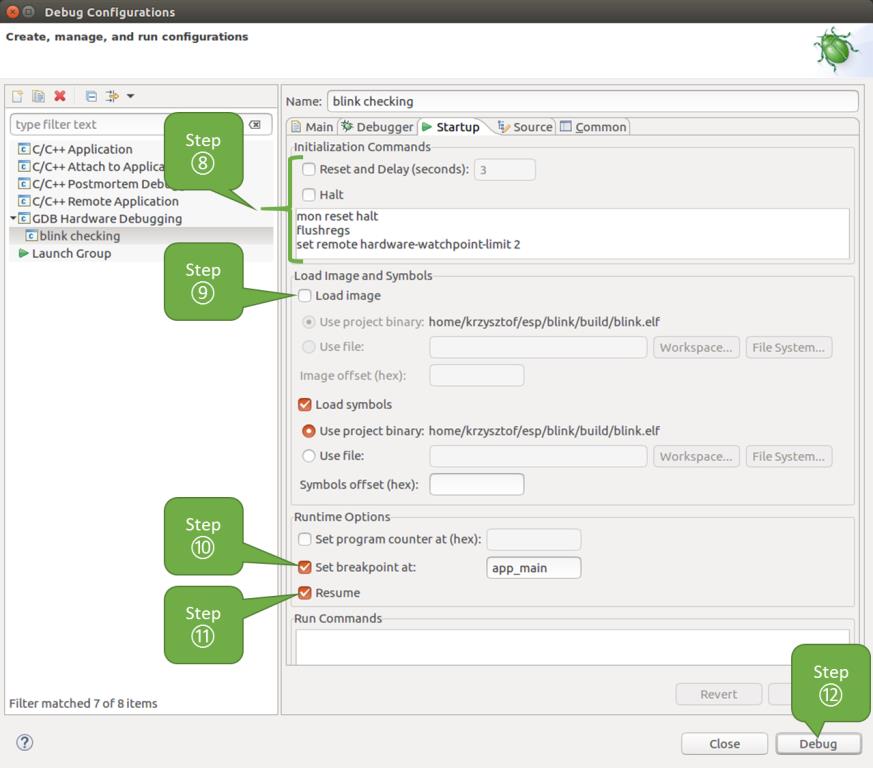
Configuration of GDB Hardware Debugging - Startup tab
If the
Startupsequence looks convoluted and respectiveInitialization Commandsare unclear, check What Is the Meaning of Debugger's Startup Commands? for additional explanation.If you have completed the Configuring ESP32 Target steps described above, so the target is running and ready to talk to debugger, go right to debugging by pressing
Debugbutton. Otherwise pressApplyto save changes, go back to Configuring ESP32 Target and return here to start debugging.Once all configuration steps 1-12 are satisfied, the new Eclipse perspective called "Debug" will open, as shown in the example picture below.
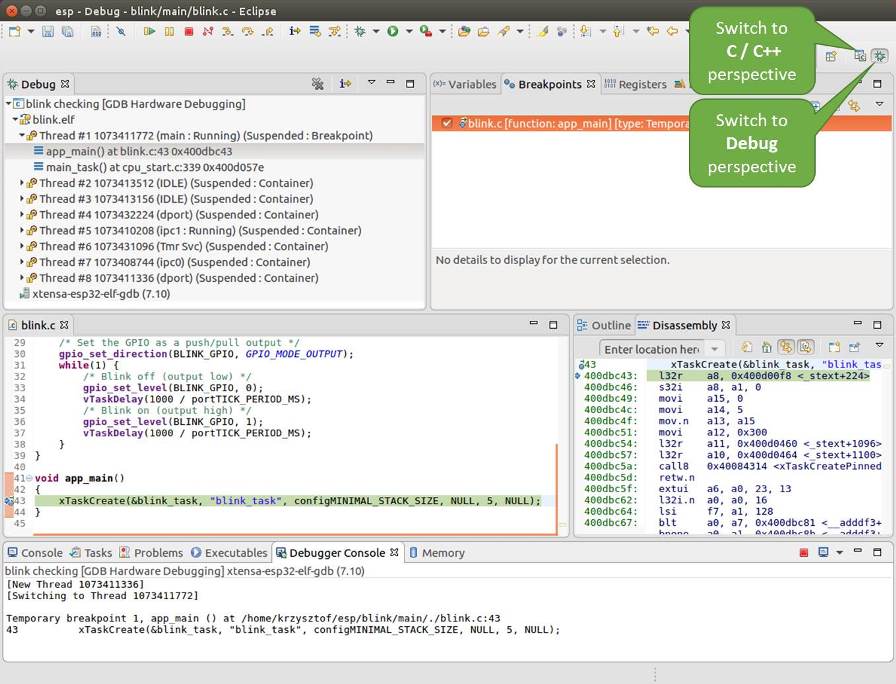
Debug Perspective in Eclipse
If you are not quite sure how to use GDB, check Eclipse example debugging session in section Debugging Examples.
Command Line
Begin by completing the steps described under Configuring ESP32 Target. This is prerequisite to start a debugging session.
Open a new terminal session and go to the directory that contains the project for debugging, e.g.,
cd ~/esp/blink
When launching a debugger, you will need to provide a couple of configuration parameters and commands. The build system generates several
.gdbinitfiles to facilitate efficient debugging. Paths to these files can be found in thebuild/project_description.json, under thegdbinit_filessection. The paths to these files are defined as follows:"gdbinit_files": { "01_symbols": "application_path/build/gdbinit/symbols", "02_prefix_map": "application_path/build/gdbinit/prefix_map", "03_py_extensions": "application_path/build/gdbinit/py_extensions", "04_connect": "application_path/build/gdbinit/connect" }
The
XX_prefix in the JSON keys is included to have ability to sort them. Sorted fields indicate the recommended order in which to provide the data to GDB.Descriptions of the generated
.gdbinitfiles:symbols- contains symbol sources for debugging.prefix_map- configures the prefix map to modify source paths in GDB. For more details, see Reproducible Builds and Debugging.py_extensions- initializes Python extensions in GDB. This requires Python built withlibpythonand a version supported by GDB. To verify compatibility, runxtensa-esp32-elf-gdb --batch-silent --ex "python import os", which should complete without errors.connect- contains commands necessary for establishing a connection to the target device.
To enhance your debugging experience, you can also create custom
.gdbinitfiles, used either alongside or in place of the generated configurations.
Now you are ready to launch GDB. Use the following example command to load symbols and connect to the target (
-qoption added to minimize startup output):xtensa-esp32-elf-gdb -q -x build/gdbinit/symbols -x build/gdbinit/prefix_map -x build/gdbinit/connect build/blink.elf
If the previous steps have been done correctly, you will see a similar log concluded with the
(gdb)prompt:xtensa-esp32-elf-gdb -q -x build/gdbinit/symbols -x build/gdbinit/prefix_map -x build/gdbinit/connect build/blink.elf user-name@computer-name:~/esp-idf/examples/get-started/blink$ xtensa-esp32-elf-gdb -q -x build/gdbinit/symbols -x build/gdbinit/connect build/blink.elf Reading symbols from build/blink.elf... add symbol table from file "/home/user-name/esp-idf/examples/get-started/blink/build/bootloader/bootloader.elf" [Switching to Thread 1070141764] app_main () at /home/user-name/esp-idf/examples/get-started/blink/main/blink_example_main.c:95 95 configure_led(); add symbol table from file "/home/alex/.espressif/tools/esp-rom-elfs/20241011/esp32_rev0_rom.elf" JTAG tap: esp32.tap0 tap/device found: 0x00005c25 (mfg: 0x612 (Espressif Systems), part: 0x0005, ver: 0x0) [esp32] Reset cause (3) - (Software core reset) Hardware assisted breakpoint 1 at 0x42009436: file /home/user-name/esp-idf/examples/get-started/blink/main/blink_example_main.c, line 92. [Switching to Thread 1070139884] Thread 2 "main" hit Temporary breakpoint 1, app_main () at /home/user-name/esp-idf/examples/get-started/blink/main/blink_example_main.c:92 92 { (gdb)Note that the third-to-last line indicates the debugger has halted at a breakpoint established in
build/gdbinit/connectfile at functionapp_main(). Since the processor is halted, the LED should not be blinking. If this matches what you observe, you are ready to start debugging.If you are not sure how to use GDB, check Command Line example debugging session in section Debugging Examples.
Idf.py Debug Targets
It is also possible to execute the described debugging tools conveniently from idf.py. These commands are supported:
idf.py openocdRuns OpenOCD in a console with configuration defined in the environment or via command line. It uses default script directory defined as
OPENOCD_SCRIPTSenvironmental variable, which is automatically added from an Export script (export.shorexport.bat). It is possible to override the script location using command line argument--openocd-scripts.To configure the JTAG configuration for the current board, please use the environmental variable
OPENOCD_COMMANDSor--openocd-commandscommand line argument. If none of the above is defined, OpenOCD is started with-f board/esp32-wrover-kit-3.3v.cfgboard definition.idf.py gdbStarts GDB in the same way as the Command Line, using generated GDB scripts referring to the current project's ELF file. For more details, see Command Line.
idf.py gdbtuiThe same as 2, but starts the gdb with
tuiargument, allowing for a simple source code view.idf.py gdbguiStarts gdbgui debugger frontend, which enables out-of-the-box debugging in a browser window. To enable this option, follow the installation instructions to set up the tool using the
pipxmethod. For system dependencies, restrictions, and other limitations, please refer to the installation page and the issue tracker.You can combine these debugging actions on a single command line, allowing for convenient setup of blocking and non-blocking actions in one step.
idf.pyimplements a simple logic to move the background actions (such as openocd) to the beginning and the interactive ones (such as gdb, monitor) to the end of the action list.An example of a very useful combination is:
idf.py openocd gdbgui monitor
The above command runs OpenOCD in the background, starts gdbgui to open a browser window with active debugger frontend and opens a serial monitor in the active console.