ESP-IDF GDB OpenOCD Debugging
Create a New Debug Configuration
Please follow the below steps to create a new debug configuration:
Right-click on the project.
Go to
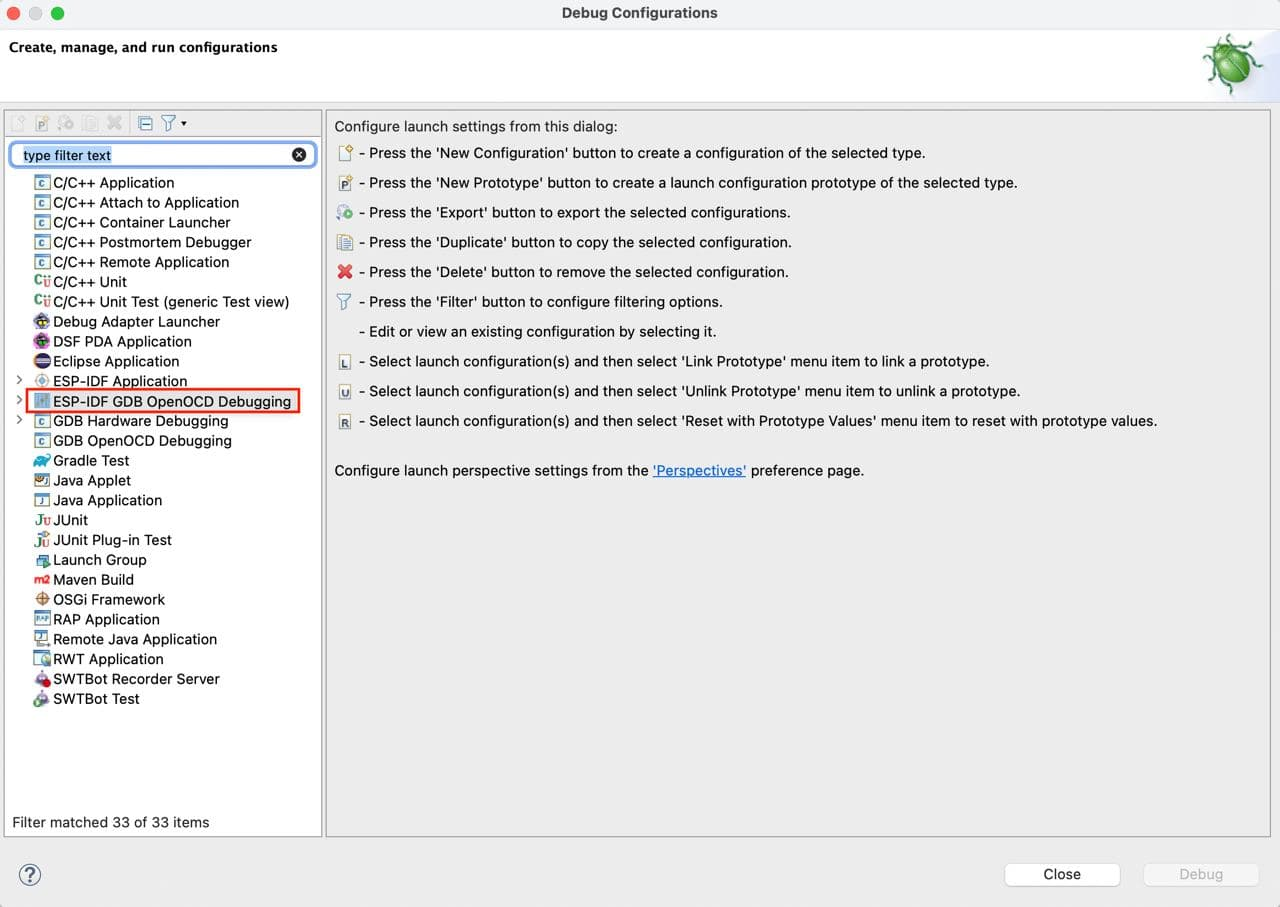
Debug As>Debug Configurations.... This will launch a debug configuration window.On the left panel, choose
ESP-IDF GDB OpenOCD Debugging.Right click and create
New Configuration. This will create a new debug configuration for your project.
Please navigate through each tab and configure project specific settings.
Note
Most of the settings are auto-configured by the plugin.
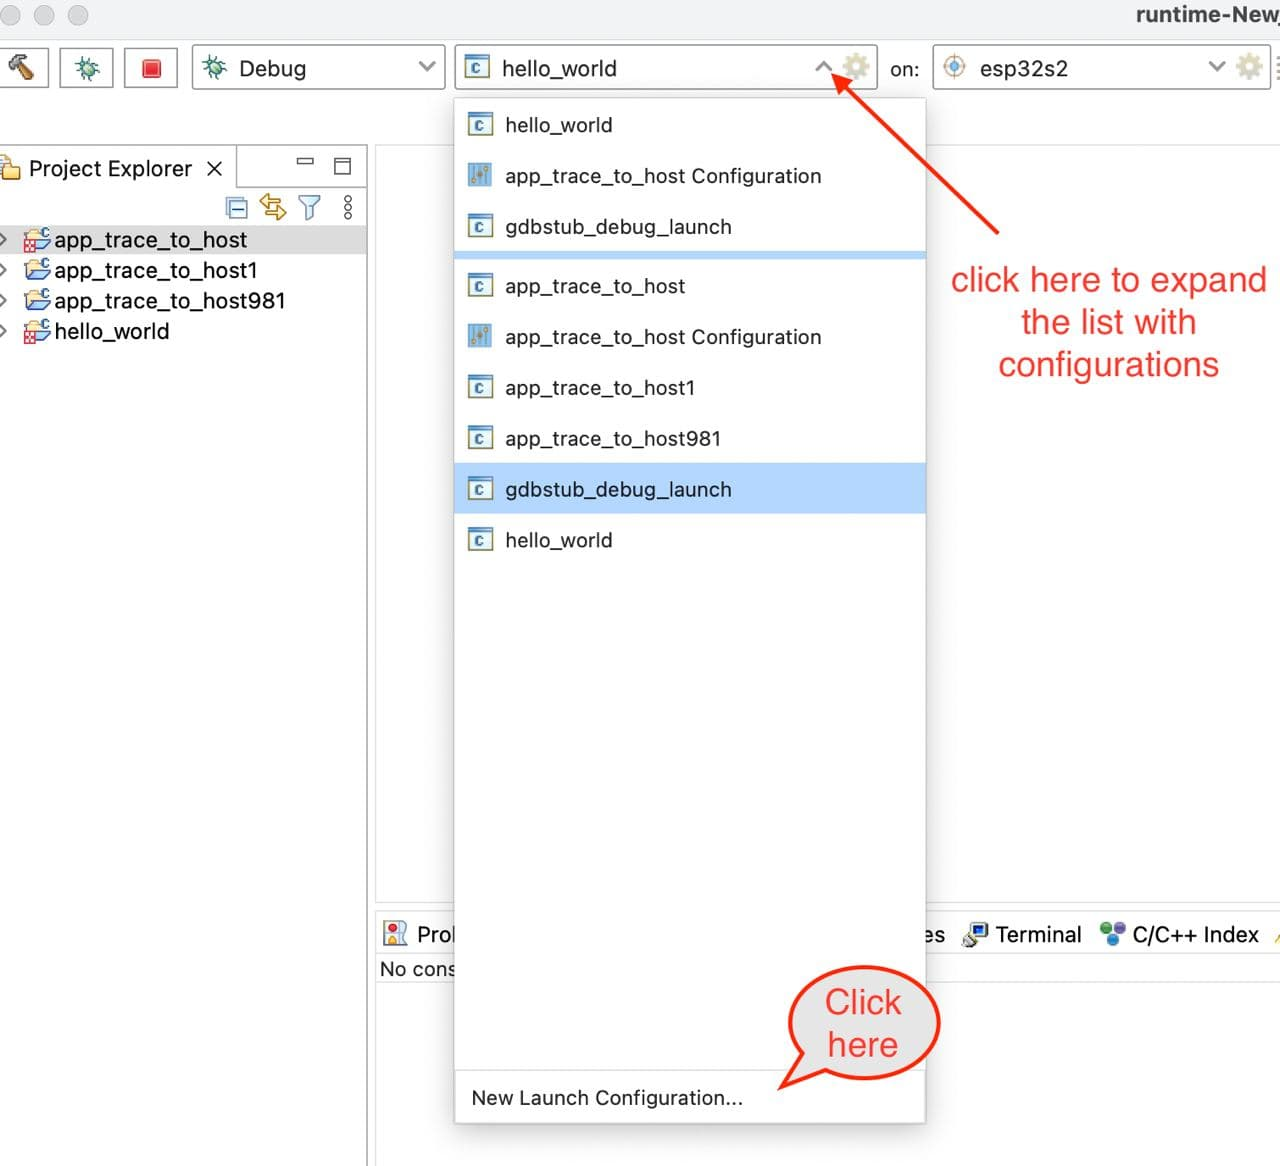
The other way to create a debug configuration is from the launch configuration bar:
Expand list with launch/debug configurations.
Click on
New Launch Configuration....Select
ESP-IDF GDB OpenOCD Debuggingand double-click on it or onNext >button.In the
Debuggertab, check if theConfig optionsis right for your board.Click on
Finish.
Main Tab
Enter the
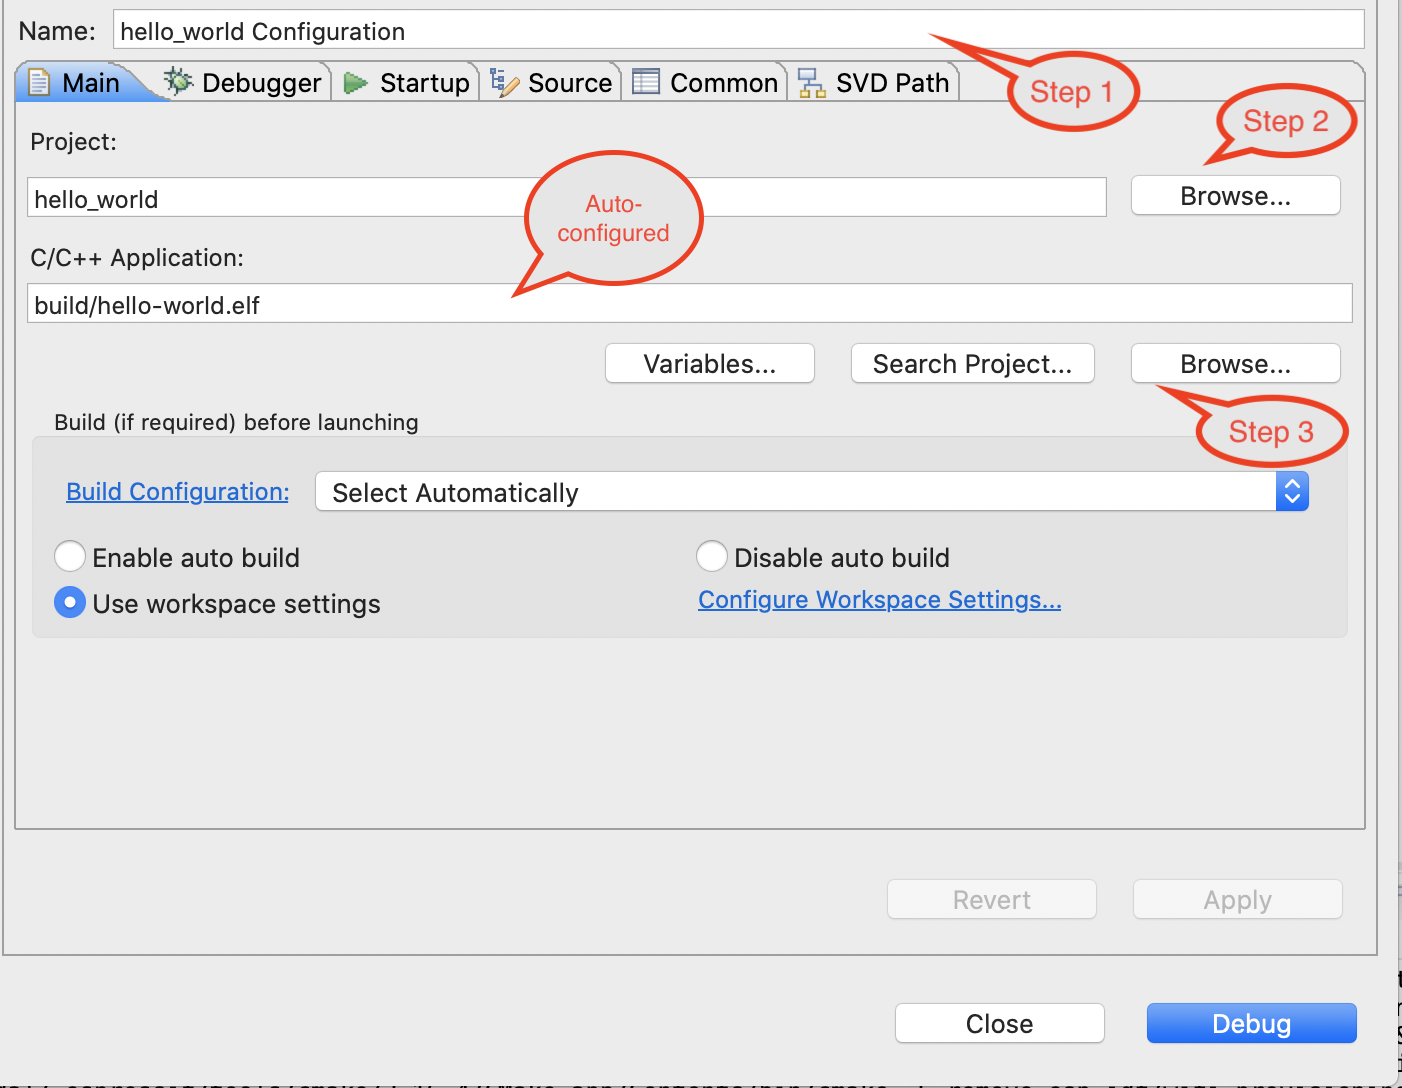
Nameof this configuration, the default name is “{project_name} Configuration”.On the
Maintab below, underProject:, pressBrowsebutton and select the project if it’s not selected or you want to change it.In the next line,
C/C++ Application:should be a relative path to the elf file, for example,build/hello_world.elfforhello_worldproject. If the elf file is not there, then likely this project has not been build yet. After building the project, the elf file will appear there. However, you can change it by pressingBrowsebutton.
The last section on the Main tab is Build (if required) before launching. If you don’t want to build the project each time you click the Debug button, then select Disable auto build.
Points 1–3 are shown below.
Debugger Tab
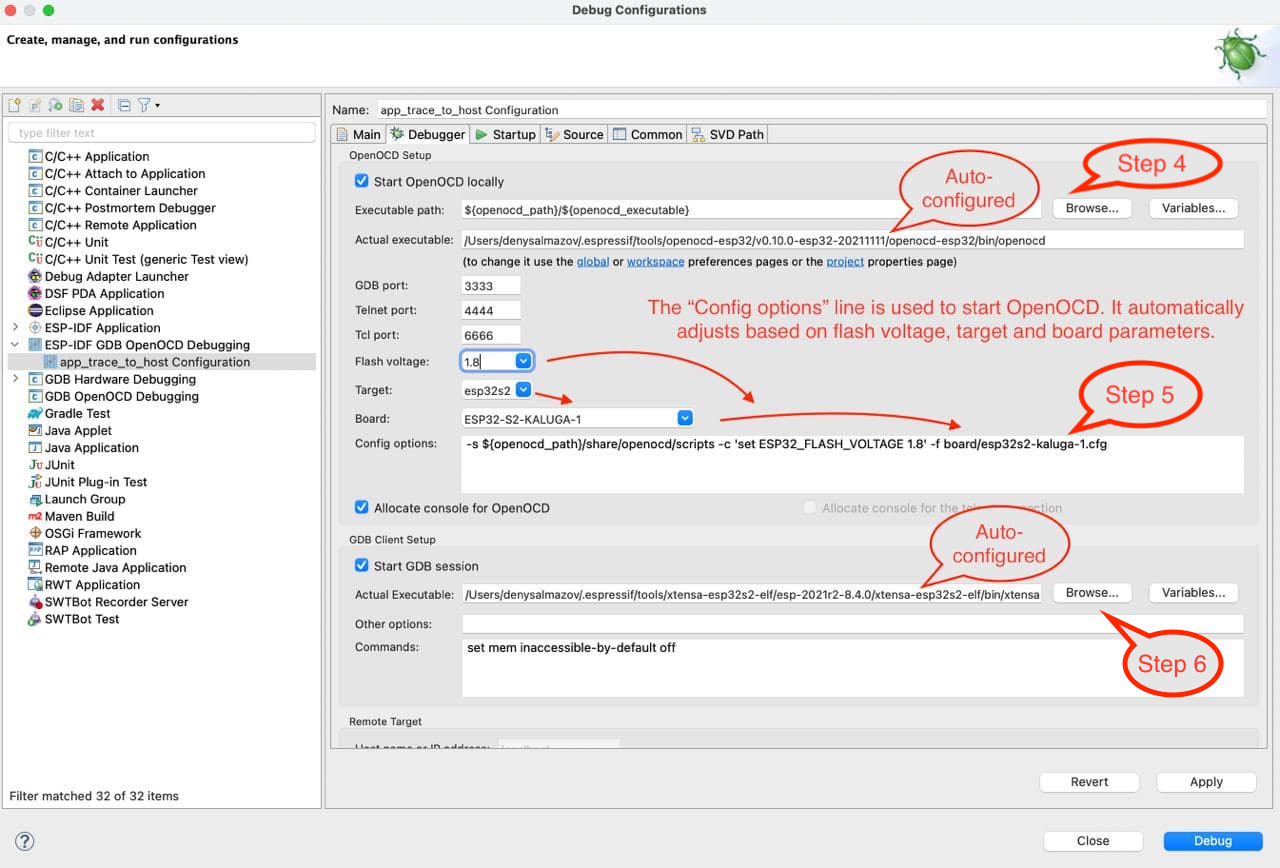
In the Debugger tab, all parameters are automatically configured to start debugging, you just need to check if the Config options line is appropriate for your board. It automatically adjusts based on Flash voltage and Board options. If you expand the list of boards, only those that match the selected Target will appear. So, for example, if the selected target is esp32, you will not see ESP32-S2-KALUGA-1 in the list. To make it appear, you need to change the target to esp32s2 first. The second option in the Debugger tab is GDB executable, which also depends on the selected target and is automatically configured based on it.
Let’s take a look at some other options, that you need to check if they auto-configured correctly for you:
The
Executable pathfor OpenOCD is based on Eclipse preferences, which are configured after tools installation. Check if theActual executableis correct. If it is not, the tools installation likely failed, so make sure tools are installed properly to avoid potential problems. IfActual executableis still not correct after tools installation, click onBrowseand select the path toopenocd.exemanually.In the next step, please make sure that the GDB port is 3333 if you want to use an internal GDB client, and the TCL port is 6666 if you want to use Application Level Tracing. Also, check
Config optionsas described above.In the
GDB Client Setupsection as described above, the GDB executable should be automatically and dynamically configured based on the target you choose. You can change it, by clickingBrowsebutton and selecting the path to the GDB executable. By default, theCommandsline should beset mem inaccessible-by-default off.
Points 4-6 are shown below.
Note
Update the OpenOCD Config options based on the ESP board you’ve chosen. See details here.
Startup Tab
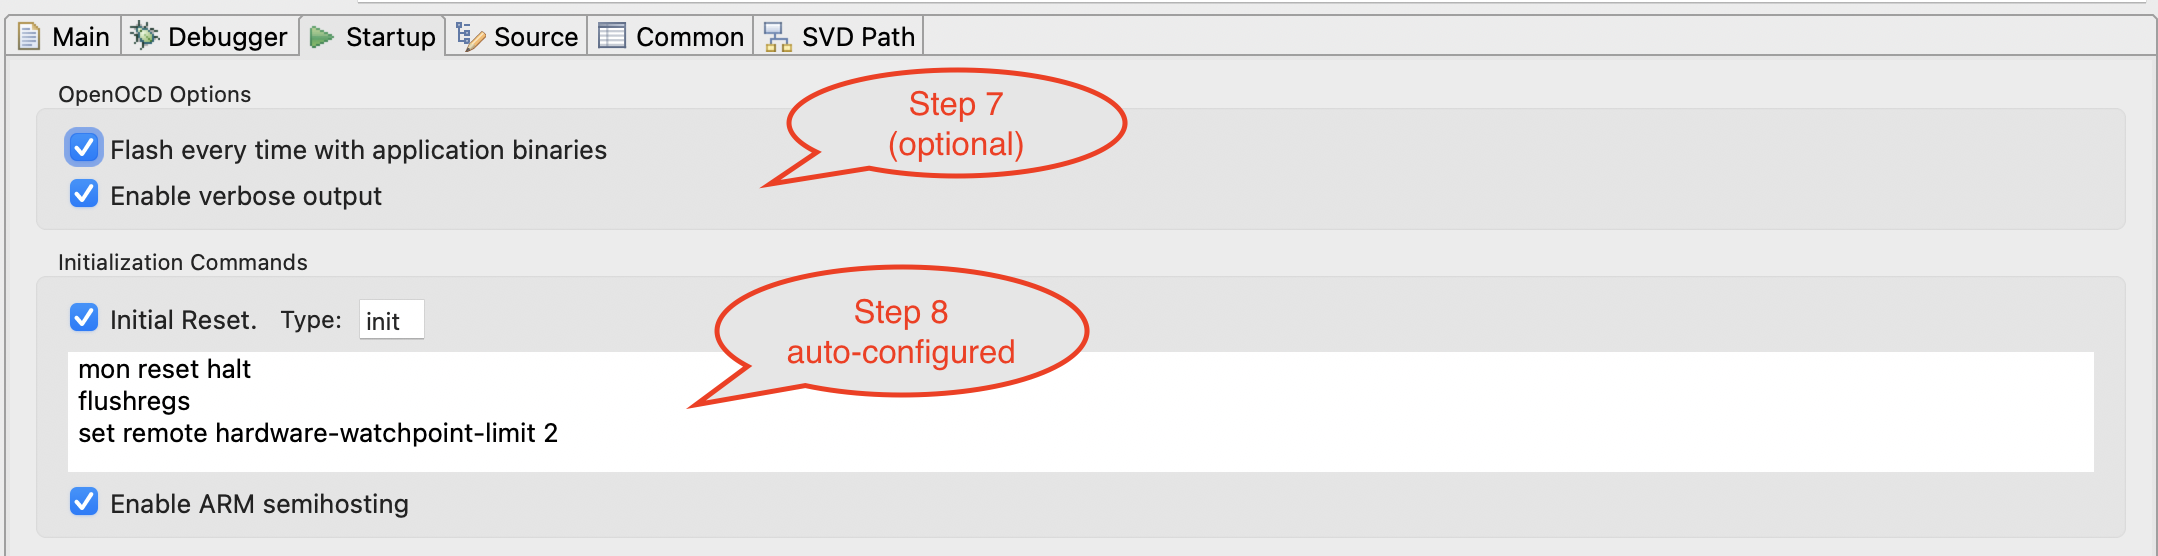
By default, the binaries will be uploaded to your board before joining a debug session, so there is no need to flash them to the target separately. If for some reason you don’t want to do that, you can uncheck the
Flash every time with application binariesoption. Also, you can checkEnable verbose outputoption, which will enable debug level 3 --d3.Under
Initialization Commands,Initial Reset.andEnable ARM semihostingare enabled by default. Then, the following lines must be entered in the field below:mon reset halt flushregs set remote hardware-watchpoint-limit 2
Points 7-8 are shown below.
Options
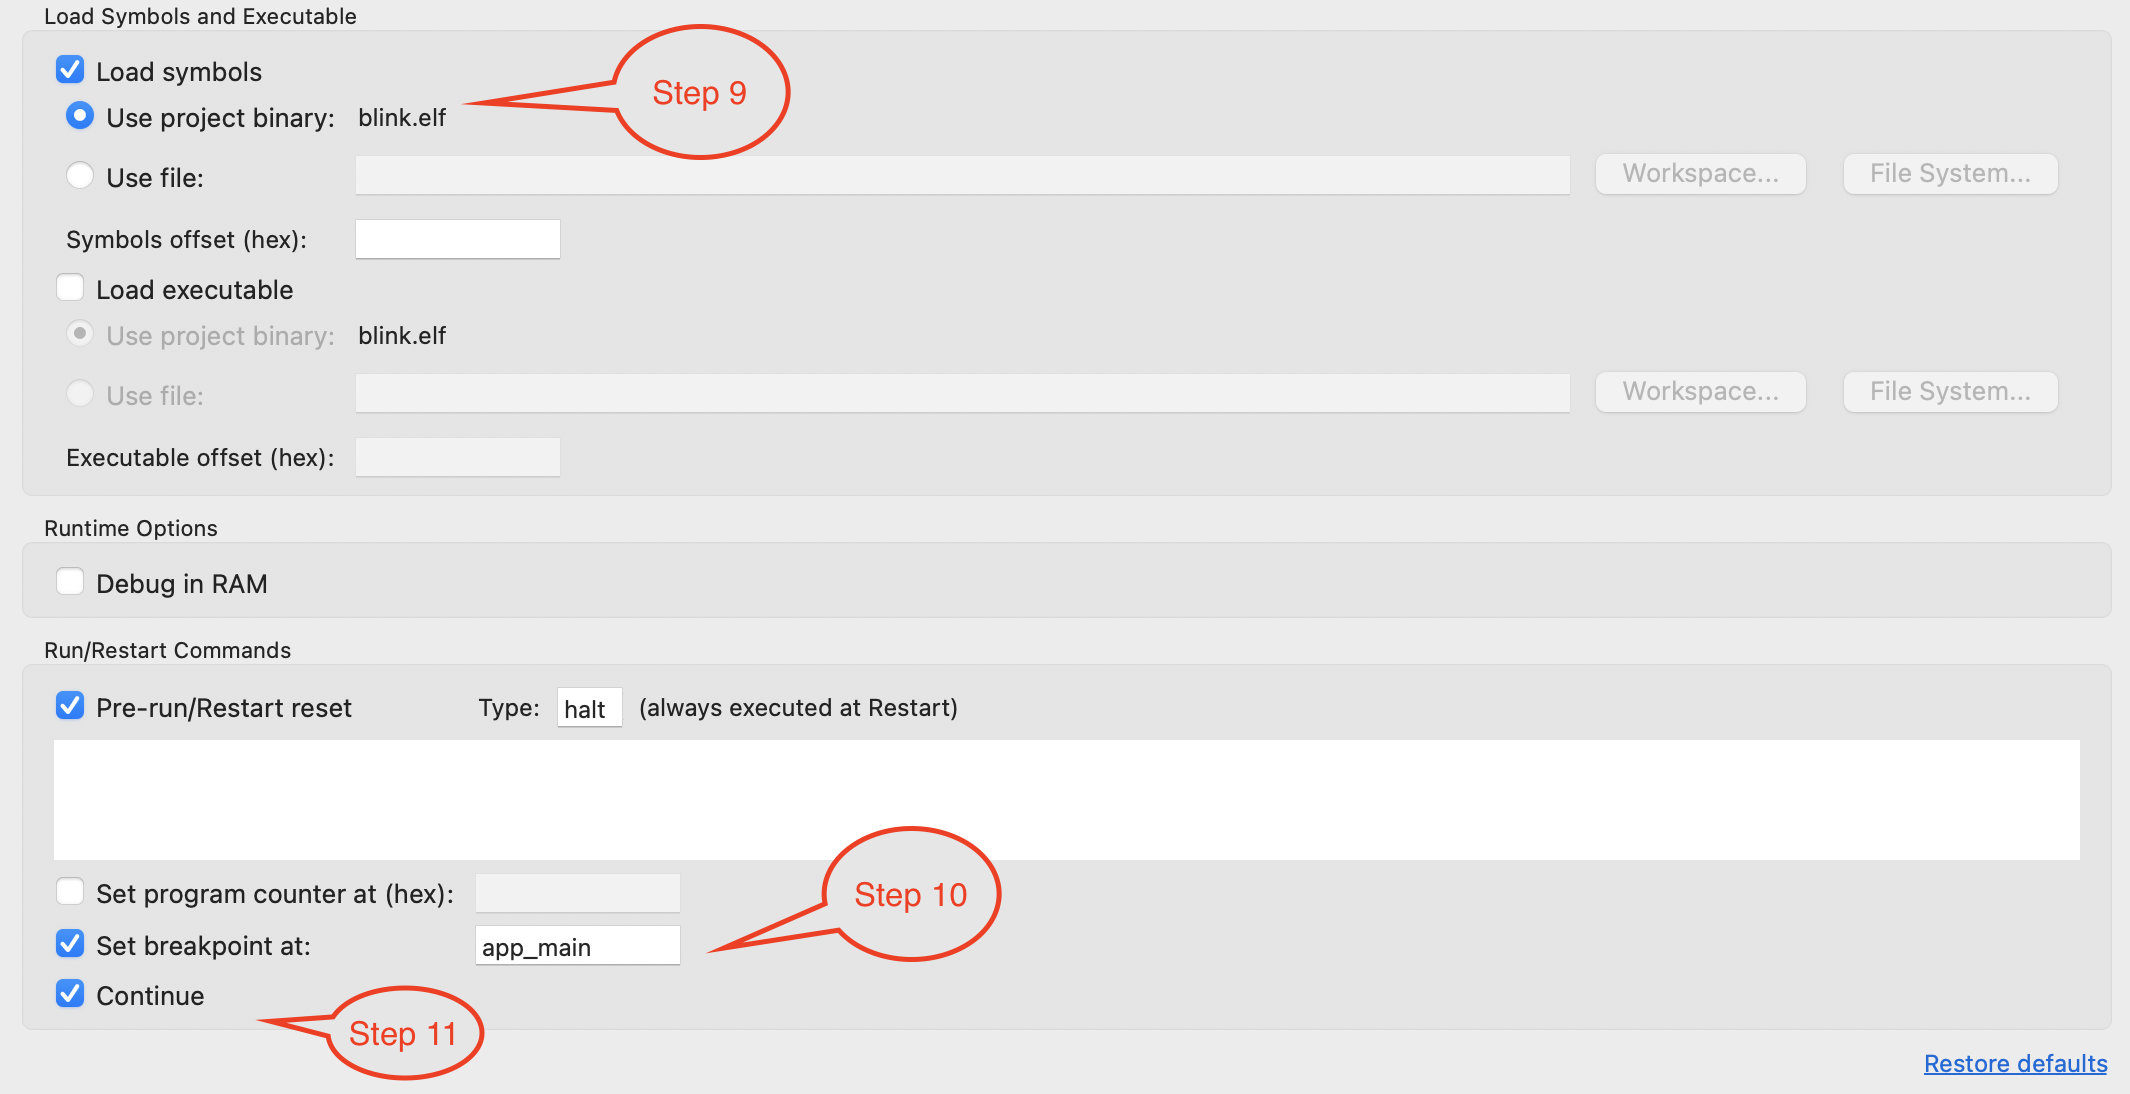
Load SymbolsandUse project binaryare selected.Further down on the same tab, establish an initial breakpoint to halt CPUs after they are reset by debugger. The plugin will set this breakpoint at the beginning of the function specified under
Set break point at:. Checkout this option and enter the name of the main function, e.g.,app_mainin provided field.Check the
Continueoption. This will make the program resume aftermon reset haltis invoked as described in point 8. The program will then stop at breakpoint inserted atapp_main.
Points 9-11 are shown below.
Common Tab
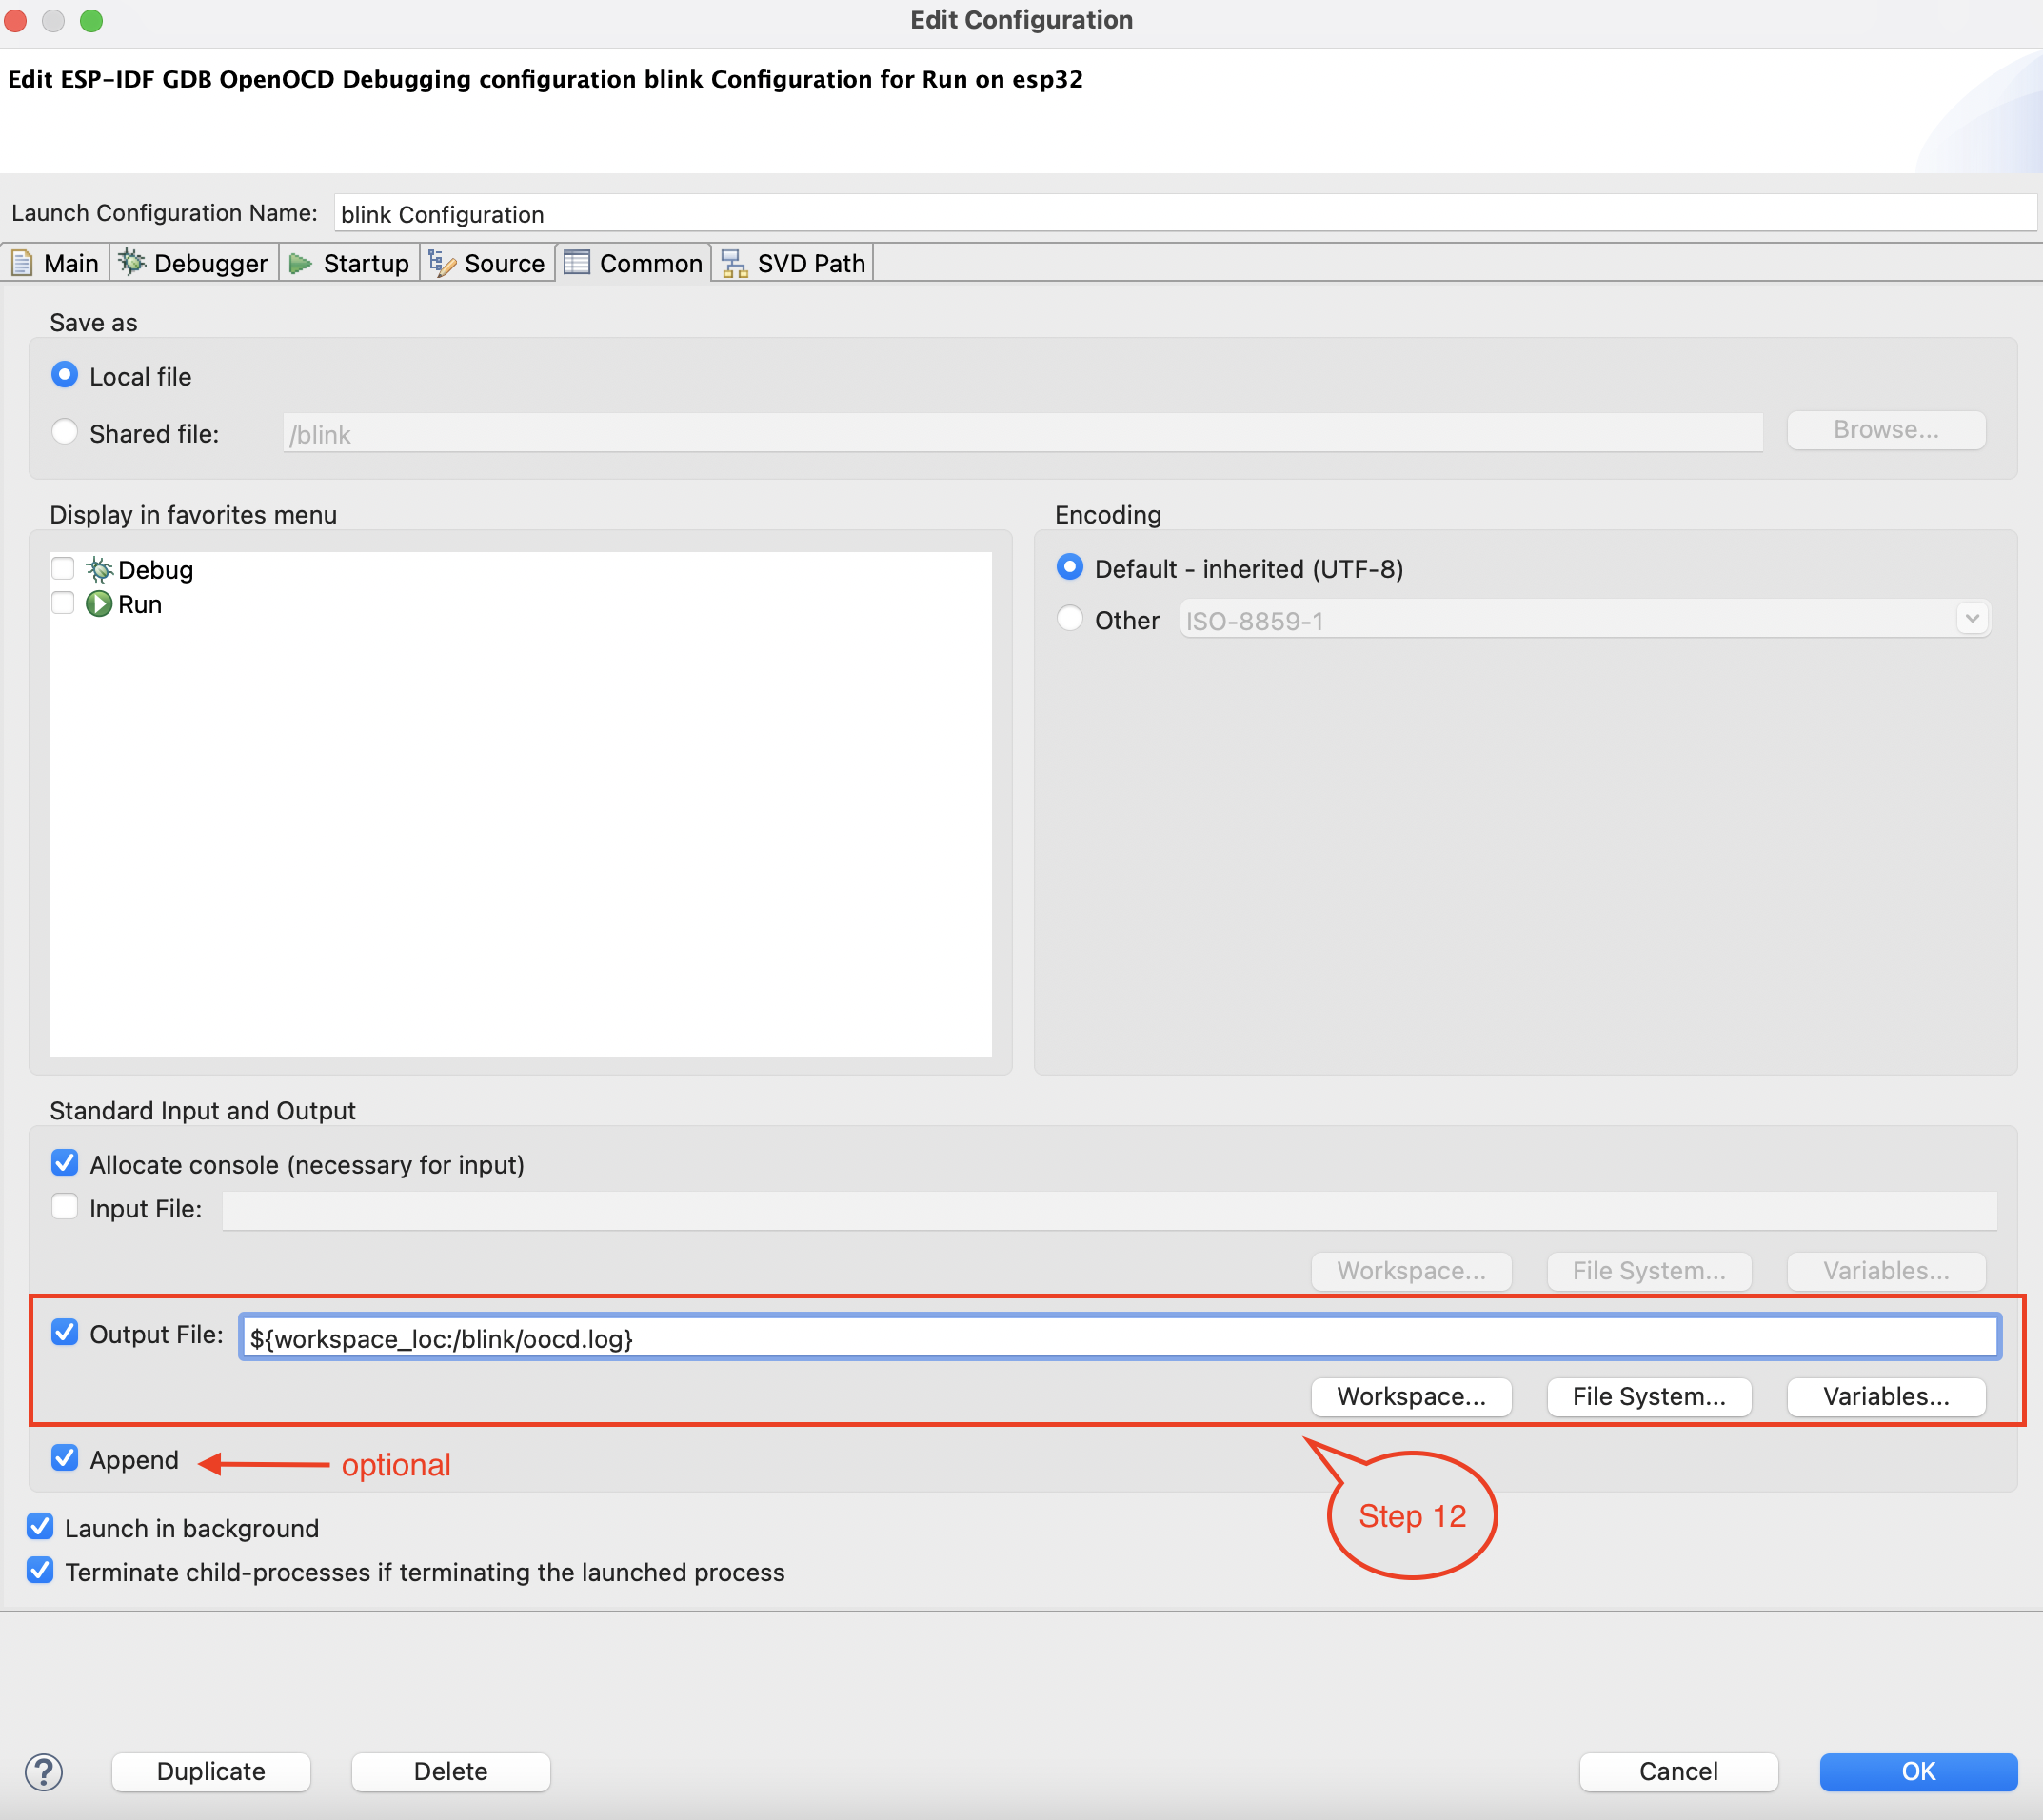
You can save your debug logs to an external file. To do this:
Go to
Commontab.Under
Standard Input and Outputsection, select theOutput Filecheckbox, then enter the log file name and path where you want logs to be redirected.Apply changes and run your application.
Note
The path can be relative if the file is located in the workspace (see the screenshot below).
When specifying a directory path (ending with a separator like
/or\), the system will automatically appendopenocd.logas the filename. For example, entering/tmp/logs/will create the file/tmp/logs/openocd.log.
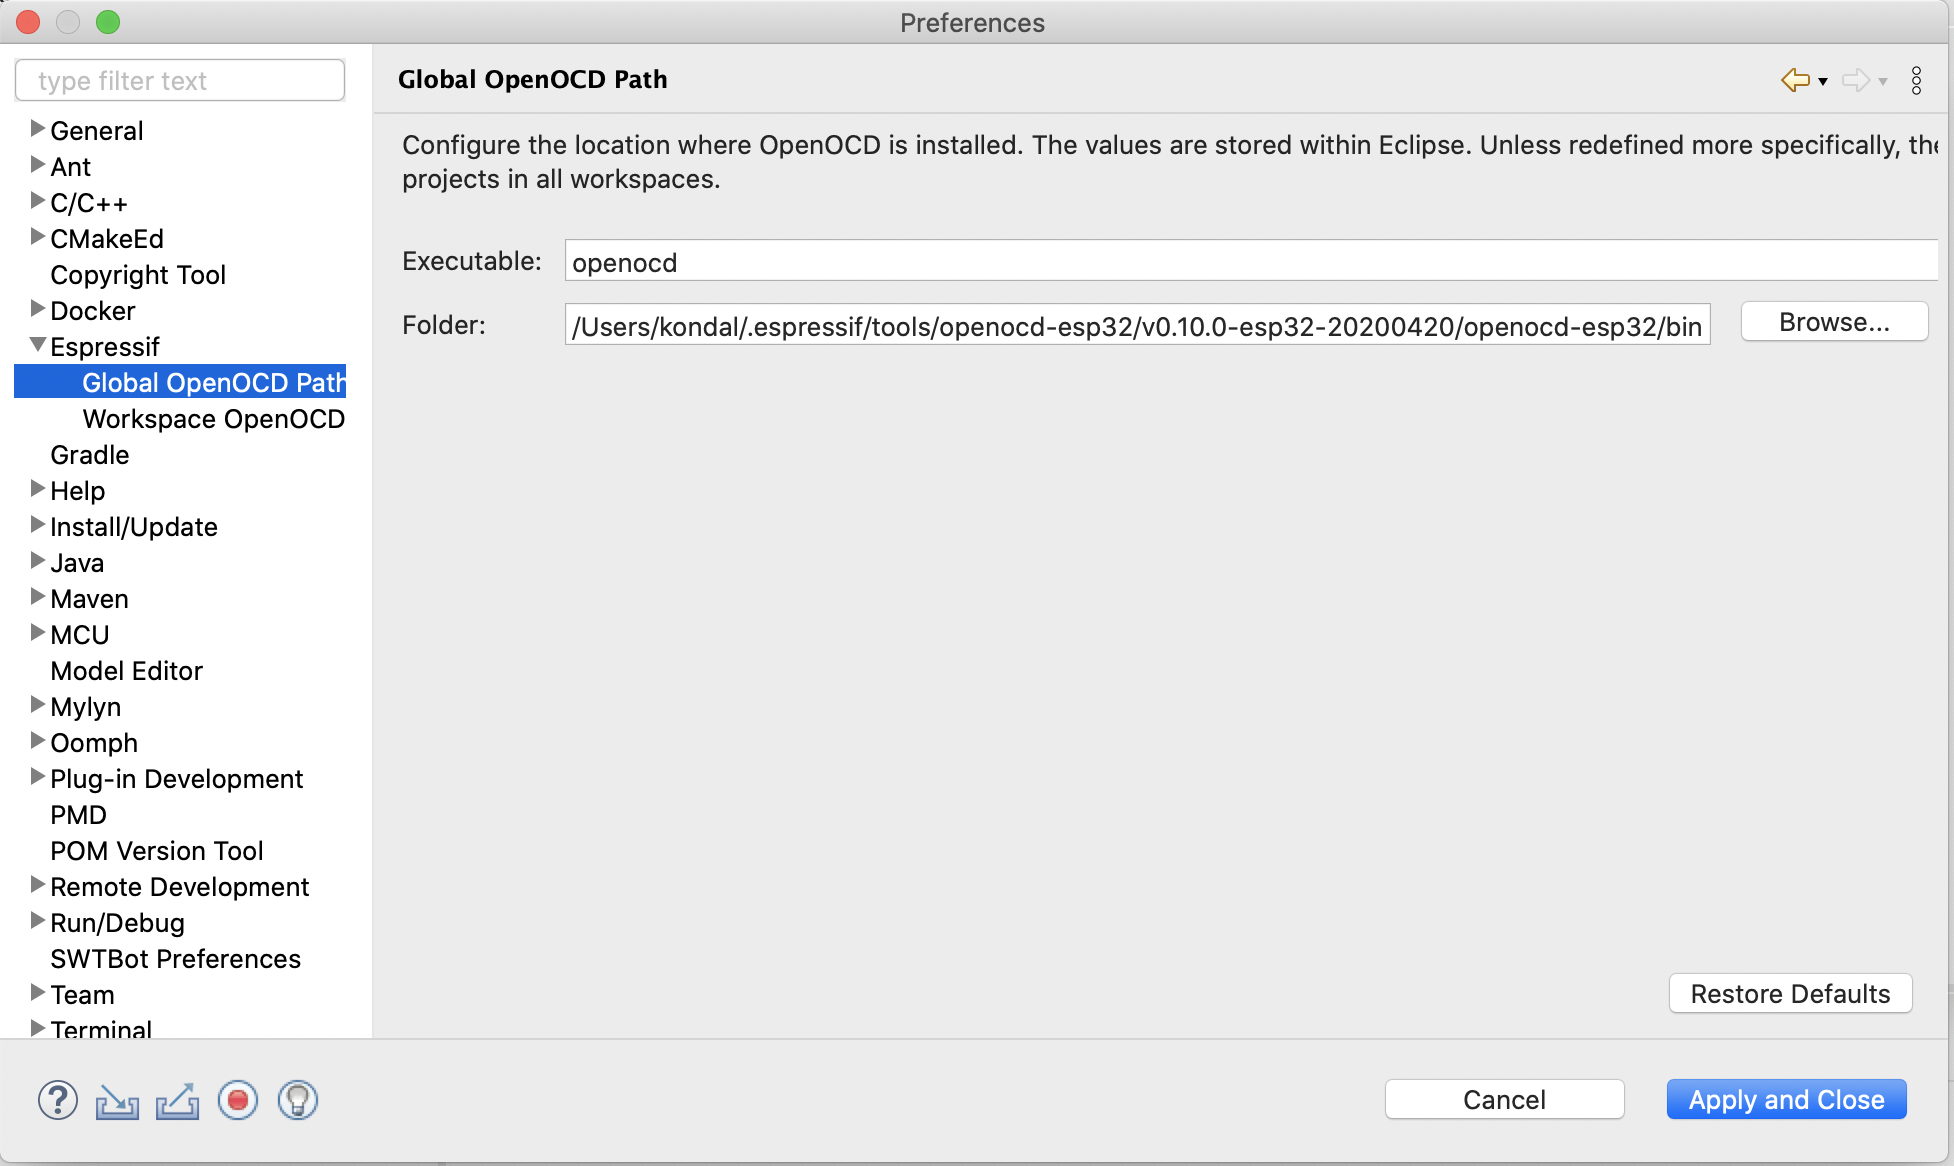
Preferences for OpenOCD Configuration
OpenOCD path is auto-configured based on the OPENOCD_SCRIPTS path defined in the CDT Build environment variables.
Start Debugging
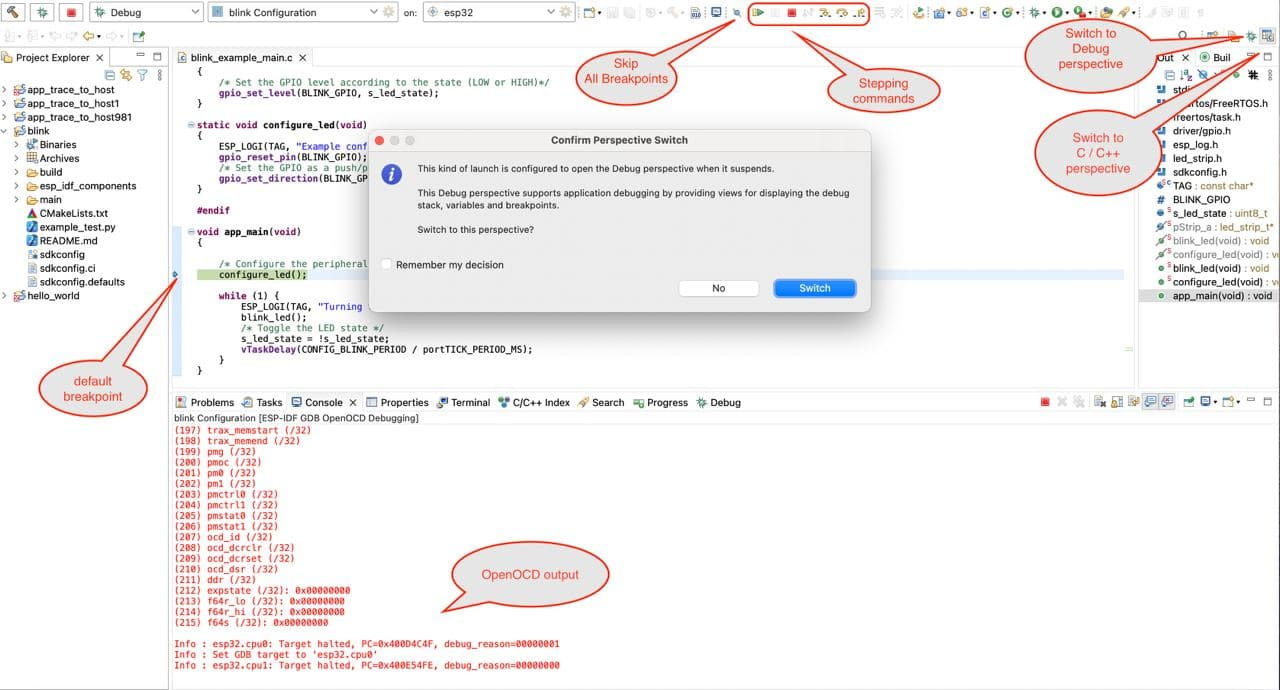
To start debugging, you need to select your debug configuration, change mode from Run to Debug and click on launch icon (i.e., bug icon).

After stopping the target at the default breakpoint, you will be suggested to switch to the Debug perspective.
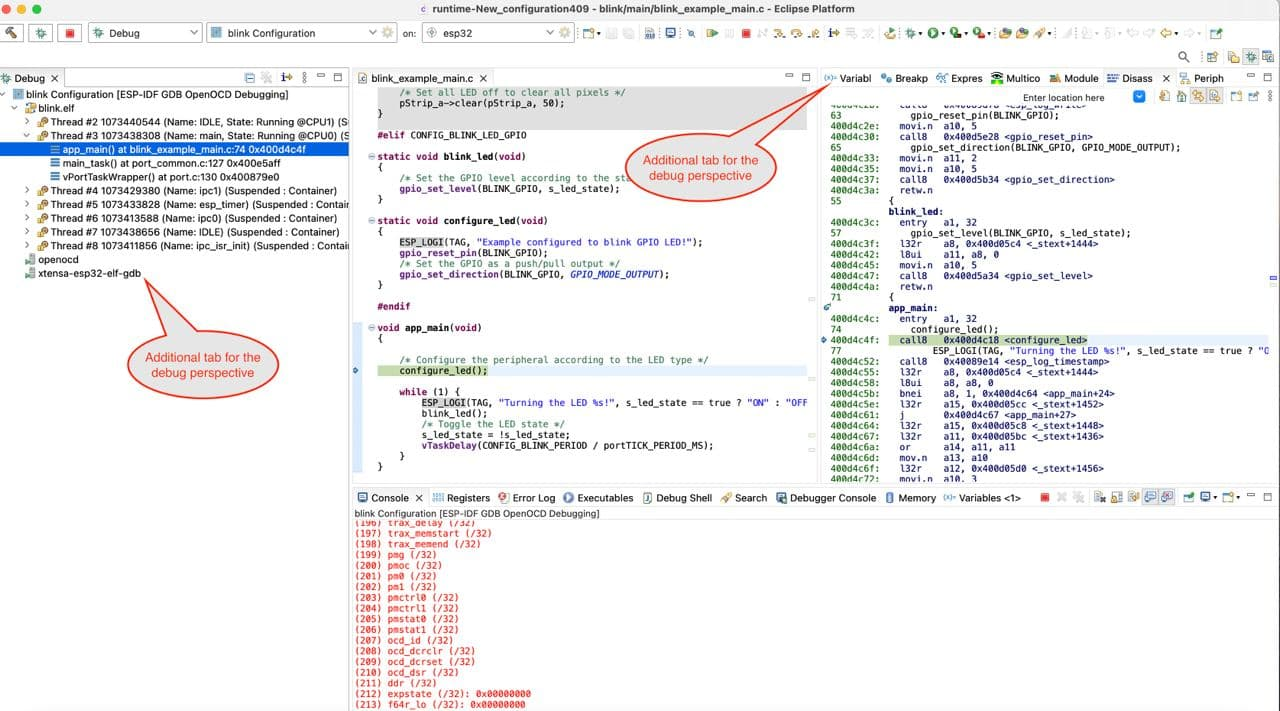
You can customize the Debug perspective to suit your preferences. For example, you can move some tabs, add additional views that you may find useful, or remove the ones you do not need. To add a view, follow these steps:
On the top panel of the Eclipse, click on
Window.Select
Show View.Select the view you want to add.
Troubleshooting
Please make sure you always have the latest Espressif-IDE.
If your board supports JTAG, see this page for more details.
If there is any OpenOCD timeout issue, please increase the GDB server timeout value https://www.esp32.com/viewtopic.php?f=40&t=36164#p122701 from the preferences. Usually, this happens while working with large-size applications.
If you encounter any errors while debugging, please refer to the OpenOCD Troubleshooting FAQ to see if it helps resolve the issue.
If you have any issue and want to enable OpenOCD debugging verbose, please check the
Enable verbose outputoption from theStartuptab.