Fatal Errors
Overview
In certain situations, execution of the program can not be continued in a well defined way. In ESP-IDF, these situations include:
CPU Exceptions: Illegal Instruction, Load/Store Alignment Error, Load/Store Prohibited error.
System level checks and safeguards:
Interrupt watchdog timeout
Task watchdog timeout (only fatal if CONFIG_ESP_TASK_WDT_PANIC is set)
Cache access error
Brownout detection event
Stack overflow
Stack smashing protection check
Heap integrity check
Failed assertions, via
assert,configASSERTand similar macros.
This guide explains the procedure used in ESP-IDF for handling these errors, and provides suggestions on troubleshooting the errors.
Panic Handler
Every error cause listed in the Overview will be handled by panic handler.
Panic handler will start by printing the cause of the error to the console. For CPU exceptions, the message will be similar to
Guru Meditation Error: Core 0 panic'ed (Illegal instruction). Exception was unhandled.
For some of the system level checks (interrupt watchdog, cache access error), the message will be similar to
Guru Meditation Error: Core 0 panic'ed (Cache error). Exception was unhandled.
In all cases, error cause will be printed in parentheses. See Guru Meditation Errors for a list of possible error causes.
Subsequent behavior of the panic handler can be set using CONFIG_ESP_SYSTEM_PANIC configuration choice. The available options are:
Print registers and reboot (
CONFIG_ESP_SYSTEM_PANIC_PRINT_REBOOT) — default option.This will print register values at the point of the exception, print the backtrace, and restart the chip.
Print registers and halt (
CONFIG_ESP_SYSTEM_PANIC_PRINT_HALT)Similar to the above option, but halt instead of rebooting. External reset is required to restart the program.
Silent reboot (
CONFIG_ESP_SYSTEM_PANIC_SILENT_REBOOT)Don’t print registers or backtrace, restart the chip immediately.
Invoke GDB Stub (
CONFIG_ESP_SYSTEM_PANIC_GDBSTUB)Start GDB server which can communicate with GDB over console UART port. See GDB Stub for more details.
Behavior of panic handler is affected by two other configuration options.
If CONFIG_ESP32C3_DEBUG_OCDAWARE is enabled (which is the default), panic handler will detect whether a JTAG debugger is connected. If it is, execution will be halted and control will be passed to the debugger. In this case registers and backtrace are not dumped to the console, and GDBStub / Core Dump functions are not used.
If Core Dump feature is enabled, then system state (task stacks and registers) will be dumped either to Flash or UART, for later analysis.
If CONFIG_ESP_PANIC_HANDLER_IRAM is disabled (disabled by default), the panic handler code is placed in flash memory not IRAM. This means that if ESP-IDF crashes while flash cache is disabled, the panic handler will automatically re-enable flash cache before running GDB Stub or Core Dump. This adds some minor risk, if the flash cache status is also corrupted during the crash.
If this option is enabled, the panic handler code is placed in IRAM. This allows the panic handler to run without needing to re-enable cache first. This may be necessary to debug some complex issues with crashes while flash cache is disabled (for example, when writing to SPI flash).
The following diagram illustrates panic handler behavior:
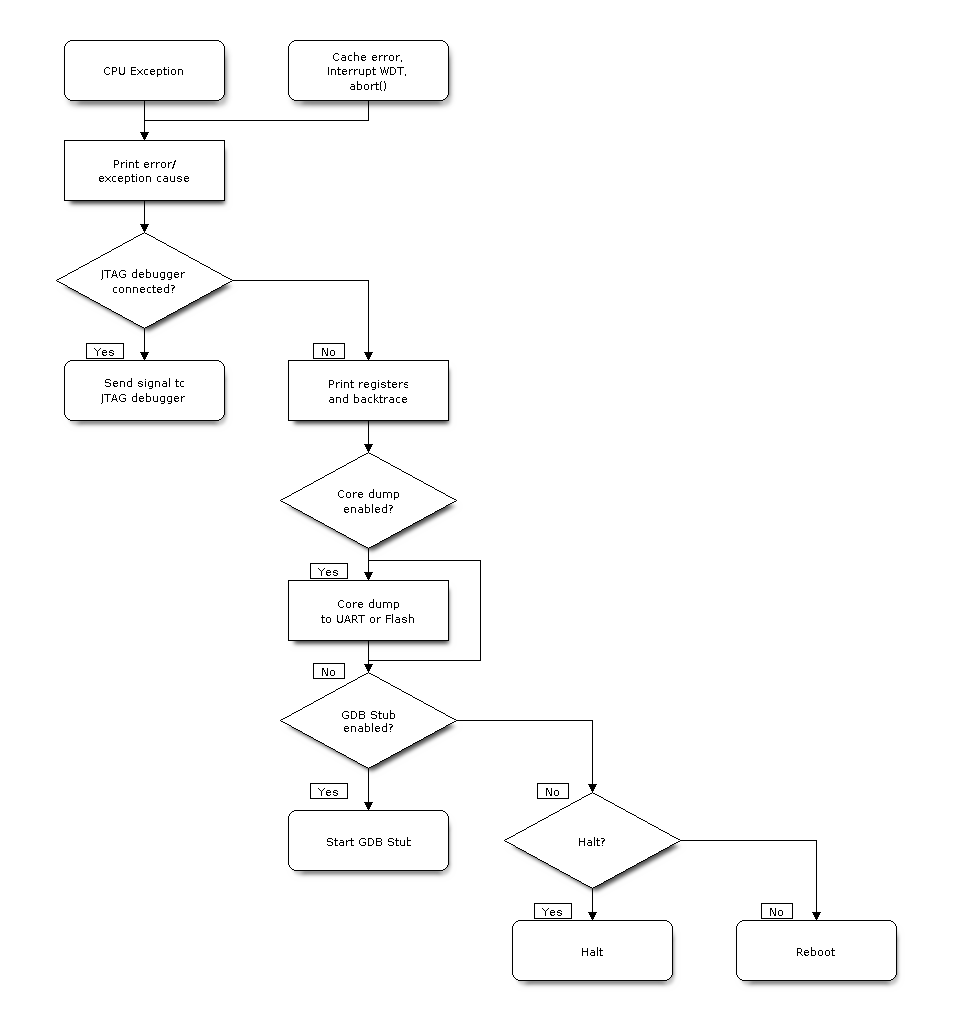
Panic Handler Flowchart (click to enlarge)
Register Dump and Backtrace
Unless CONFIG_ESP_SYSTEM_PANIC_SILENT_REBOOT option is enabled, panic handler prints some of the CPU registers, and the backtrace, to the console
Core  0 register dump:
MEPC    : 0x420048b4  RA      : 0x420048b4  SP      : 0x3fc8f2f0  GP      : 0x3fc8a600
TP      : 0x3fc8a2ac  T0      : 0x40057fa6  T1      : 0x0000000f  T2      : 0x00000000
S0/FP   : 0x00000000  S1      : 0x00000000  A0      : 0x00000001  A1      : 0x00000001
A2      : 0x00000064  A3      : 0x00000004  A4      : 0x00000001  A5      : 0x00000000
A6      : 0x42001fd6  A7      : 0x00000000  S2      : 0x00000000  S3      : 0x00000000
S4      : 0x00000000  S5      : 0x00000000  S6      : 0x00000000  S7      : 0x00000000
S8      : 0x00000000  S9      : 0x00000000  S10     : 0x00000000  S11     : 0x00000000
T3      : 0x00000000  T4      : 0x00000000  T5      : 0x00000000  T6      : 0x00000000
MSTATUS : 0x00001881  MTVEC   : 0x40380001  MCAUSE  : 0x00000007  MTVAL   : 0x00000000
MHARTID : 0x00000000
Register values printed are the register values in the exception frame, i.e. values at the moment when CPU exception or other fatal error has occured.
Register dump is not printed if the panic handler was executed as a result of an abort() call.
If IDF Monitor is used, Program Counter values will be converted to code locations (function name, file name, and line number), and the output will be annotated with additional lines
Core  0 register dump:
MEPC    : 0x420048b4  RA      : 0x420048b4  SP      : 0x3fc8f2f0  GP      : 0x3fc8a600
0x420048b4: app_main at /Users/user/esp/example/main/hello_world_main.c:20

0x420048b4: app_main at /Users/user/esp/example/main/hello_world_main.c:20

TP      : 0x3fc8a2ac  T0      : 0x40057fa6  T1      : 0x0000000f  T2      : 0x00000000
S0/FP   : 0x00000000  S1      : 0x00000000  A0      : 0x00000001  A1      : 0x00000001
A2      : 0x00000064  A3      : 0x00000004  A4      : 0x00000001  A5      : 0x00000000
A6      : 0x42001fd6  A7      : 0x00000000  S2      : 0x00000000  S3      : 0x00000000
0x42001fd6: uart_write at /Users/user/esp/esp-idf/components/vfs/vfs_uart.c:201

S4      : 0x00000000  S5      : 0x00000000  S6      : 0x00000000  S7      : 0x00000000
S8      : 0x00000000  S9      : 0x00000000  S10     : 0x00000000  S11     : 0x00000000
T3      : 0x00000000  T4      : 0x00000000  T5      : 0x00000000  T6      : 0x00000000
MSTATUS : 0x00001881  MTVEC   : 0x40380001  MCAUSE  : 0x00000007  MTVAL   : 0x00000000
MHARTID : 0x00000000
To find the location where a fatal error has happened, look at the lines which follow the “Backtrace” line. Fatal error location is the top line, and subsequent lines show the call stack.
GDB Stub
If CONFIG_ESP_SYSTEM_PANIC_GDBSTUB option is enabled, panic handler will not reset the chip when fatal error happens. Instead, it will start GDB remote protocol server, commonly referred to as GDB Stub. When this happens, GDB instance running on the host computer can be instructed to connect to the ESP32-C3 UART port.
If IDF Monitor is used, GDB is started automatically when GDB Stub prompt is detected on the UART. The output would look like this:
Entering gdb stub now.
$T0b#e6GNU gdb (crosstool-NG crosstool-ng-1.22.0-80-gff1f415) 7.10
Copyright (C) 2015 Free Software Foundation, Inc.
License GPLv3+: GNU GPL version 3 or later <http://gnu.org/licenses/gpl.html>
This is free software: you are free to change and redistribute it.
There is NO WARRANTY, to the extent permitted by law.  Type "show copying"
and "show warranty" for details.
This GDB was configured as "--host=x86_64-build_apple-darwin16.3.0 --target=riscv32-esp-elf".
Type "show configuration" for configuration details.
For bug reporting instructions, please see:
<http://www.gnu.org/software/gdb/bugs/>.
Find the GDB manual and other documentation resources online at:
<http://www.gnu.org/software/gdb/documentation/>.
For help, type "help".
Type "apropos word" to search for commands related to "word"...
Reading symbols from /Users/user/esp/example/build/example.elf...done.
Remote debugging using /dev/cu.usbserial-31301
0x400e1b41 in app_main ()
    at /Users/user/esp/example/main/main.cpp:36
36      *((int*) 0) = 0;
(gdb)
GDB prompt can be used to inspect CPU registers, local and static variables, and arbitrary locations in memory. It is not possible to set breakpoints, change PC, or continue execution. To reset the program, exit GDB and perform external reset: Ctrl-T Ctrl-R in IDF Monitor, or using external reset button on the development board.
Guru Meditation Errors
This section explains the meaning of different error causes, printed in parens after Guru Meditation Error: Core panic'ed message.
Note
See Wikipedia article for historical origins of “Guru Meditation”.
Illegal instruction
This CPU exception indicates that the instruction which was executed was not a valid instruction. Most common reasons for this error include:
FreeRTOS task function has returned. In FreeRTOS, if task function needs to terminate, it should call
vTaskDelete()function and delete itself, instead of returning.Failure to load next instruction from SPI flash. This usually happens if:
Application has reconfigured SPI flash pins as some other function (GPIO, UART, etc.). Consult Hardware Design Guidelines and the Datasheet for the chip or module for details about SPI flash pins.
Some external device was accidentally connected to SPI flash pins, and has interfered with communication between ESP32-C3 and SPI flash.
Instruction address misaligned
This CPU exception indicates that the address of the instruction to execute is not 2-byte aligned.
Instruction access fault, Load access fault, Store access fault
This CPU exception happens when application attempts to execute, read from or write to an invalid memory location. The address which was written/read is found in MTVAL register in the register dump. If this address is zero, it usually means that application attempted to dereference a NULL pointer. If this address is close to zero, it usually means that application attempted to access member of a structure, but the pointer to the structure was NULL. If this address is something else (garbage value, not in 0x3fxxxxxx - 0x6xxxxxxx range), it likely means that the pointer used to access the data was either not initialized or was corrupted.
Breakpoint
This CPU exception happens when the instruction EBREAK is executed.
Load address misaligned, Store address misaligned
Application has attempted to read or write memory location, and address alignment did not match load/store size. For example, 32-bit load can only be done from 4-byte aligned address, and 16-bit load can only be done from a 2-byte aligned address.
Interrupt wdt timeout on CPU0 / CPU1
Indicates that interrupt watchdog timeout has occured. See Watchdogs for more information.
Cache error
In some situations ESP-IDF will temporarily disable access to external SPI Flash and SPI RAM via caches. For example, this happens with spi_flash APIs are used to read/write/erase/mmap regions of SPI Flash. In these situations, tasks are suspended, and interrupt handlers not registered with ESP_INTR_FLAG_IRAM are disabled. Make sure that any interrupt handlers registered with this flag have all the code and data in IRAM/DRAM. Refer to the SPI flash API documentation for more details.
Other Fatal Errors
Brownout
ESP32-C3 has a built-in brownout detector, which is enabled by default. Brownout detector can trigger system reset if supply voltage goes below safe level. Brownout detector can be configured using CONFIG_ESP32C3_BROWNOUT_DET and CONFIG_ESP32C3_BROWNOUT_DET_LVL_SEL options.
When brownout detector triggers, the following message is printed:
Brownout detector was triggered
Chip is reset after the message is printed.
Note that if supply voltage is dropping at a fast rate, only part of the message may be seen on the console.
Corrupt Heap
ESP-IDF heap implementation contains a number of run-time checks of heap structure. Additional checks (“Heap Poisoning”) can be enabled in menuconfig. If one of the checks fails, message similar to the following will be printed:
CORRUPT HEAP: Bad tail at 0x3ffe270a. Expected 0xbaad5678 got 0xbaac5678
assertion "head != NULL" failed: file "/Users/user/esp/esp-idf/components/heap/multi_heap_poisoning.c", line 201, function: multi_heap_free
abort() was called at PC 0x400dca43 on core 0
Consult Heap Memory Debugging documentation for further information.
Stack Smashing
Stack smashing protection (based on GCC -fstack-protector* flags) can be enabled in ESP-IDF using CONFIG_COMPILER_STACK_CHECK_MODE option. If stack smashing is detected, message similar to the following will be printed:
Stack smashing protect failure!

abort() was called at PC 0x400d2138 on core 0

Backtrace: 0x4008e6c0:0x3ffc1780 0x4008e8b7:0x3ffc17a0 0x400d2138:0x3ffc17c0 0x400e79d5:0x3ffc17e0 0x400e79a7:0x3ffc1840 0x400e79df:0x3ffc18a0 0x400e2235:0x3ffc18c0 0x400e1916:0x3ffc18f0 0x400e19cd:0x3ffc1910 0x400e1a11:0x3ffc1930 0x400e1bb2:0x3ffc1950 0x400d2c44:0x3ffc1a80
0
The backtrace should point to the function where stack smashing has occured. Check the function code for unbounded access to local arrays.