Application Level Tracing
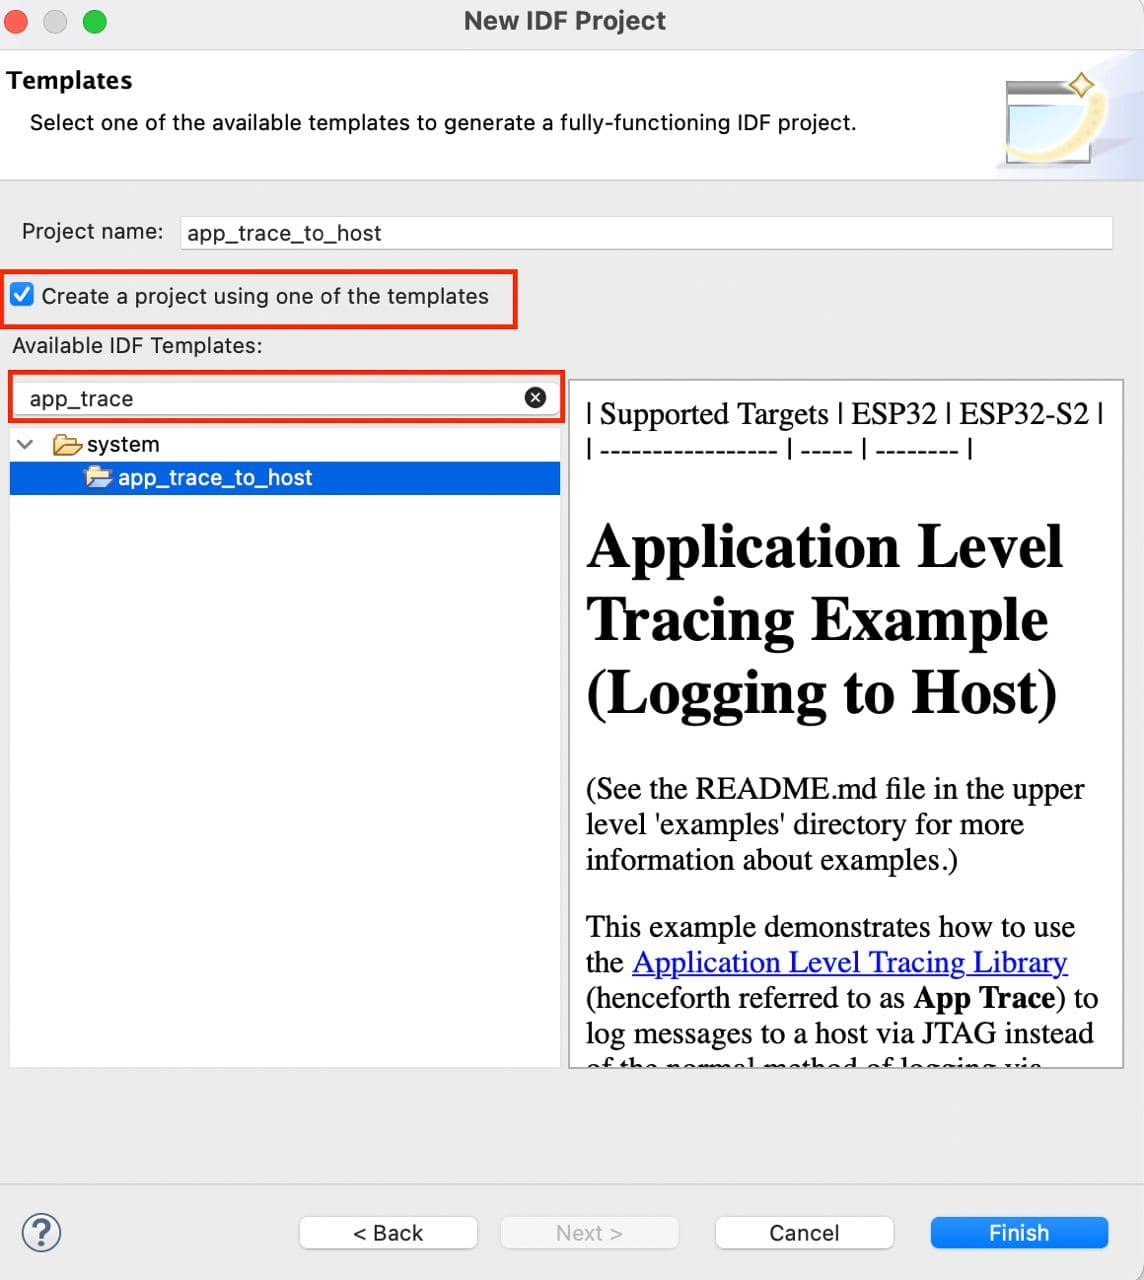
ESP-IDF provides a useful feature for program behavior analysis called Application Level Tracing Library. The IDF-Eclipse plugin provides a UI that allows you to start and stop tracing commands and process the received data. To get familiar with this library, you can use the app_trace_to_host project or the app_trace_basic project (if you are using ESP-IDF 5.1 or higher). These projects can be created directly from the plugin.
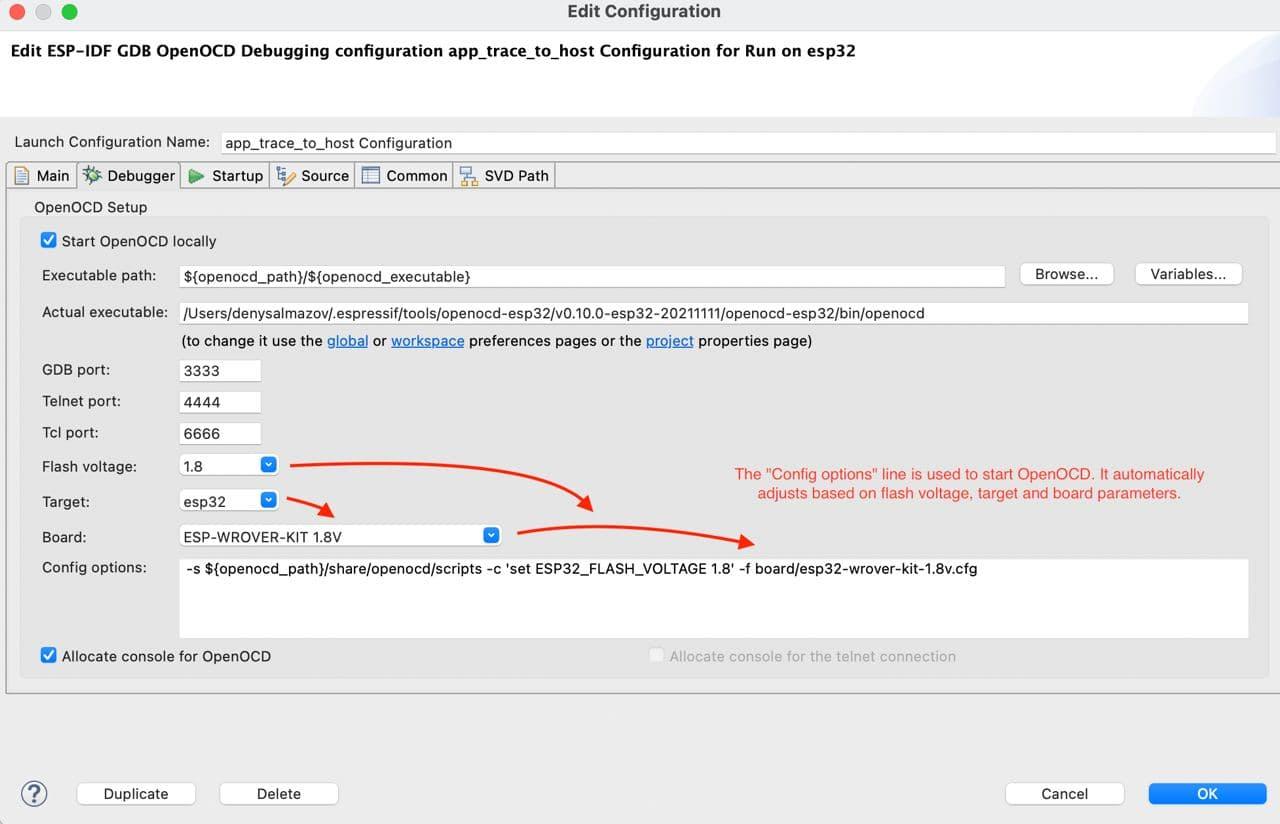
Before using application-level tracing, create a debug configuration for the project where you must select the board you are using to successfully start the OpenOCD server.
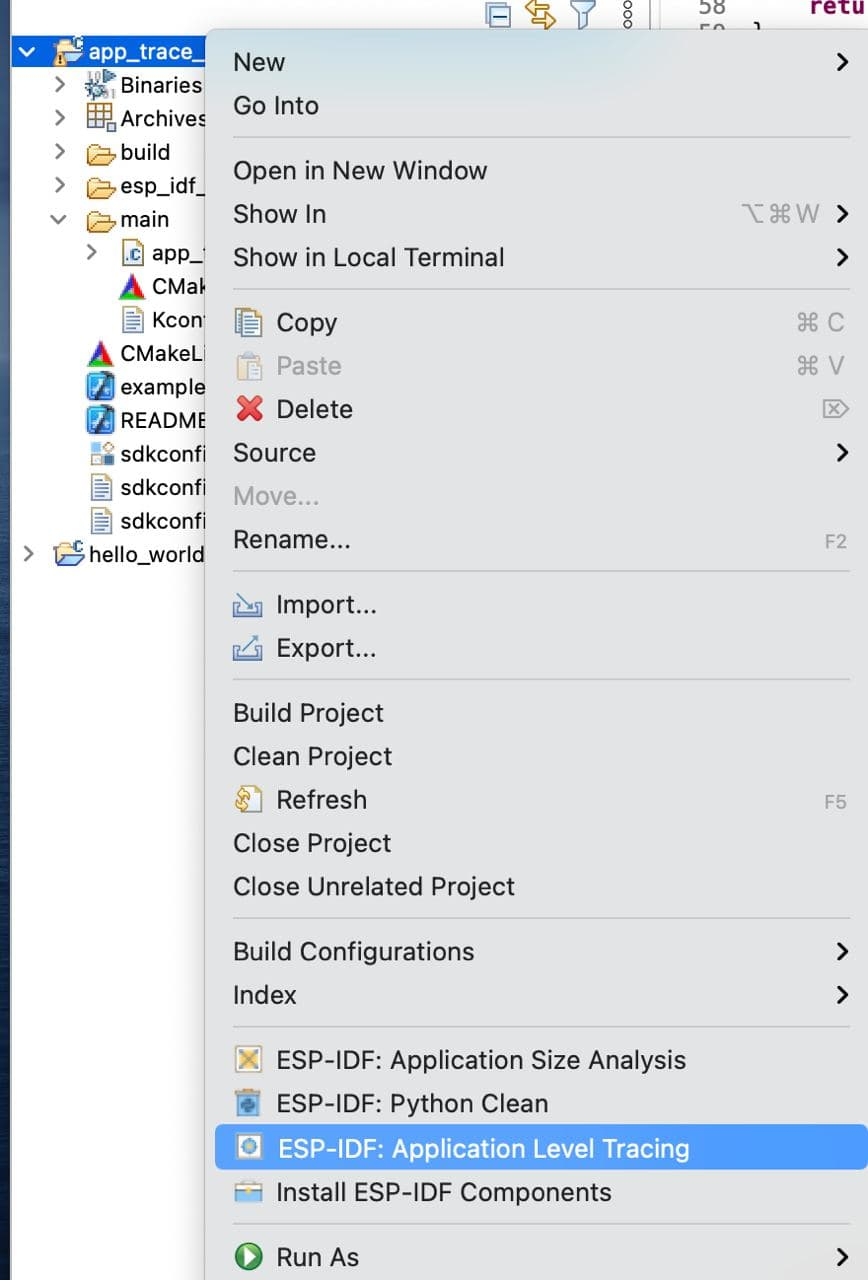
After creating the debug configuration, right-click on the project in the Project Explorer and select ESP-IDF: Application Level Tracing.
It may take a moment to open the application level tracing dialog, as the OpenOCD server starts first. At the top of the dialog, you will find auto-configured fields that can be adjusted if needed for the trace start command.
Start Command:
Syntax:
start <outfile> [poll_period [trace_size [stop_tmo [wait4halt [skip_size]]]]Arguments:
outfile: Path to the file where data from both CPUs will be saved, with formatfile://path/to/file.poll_period: Data polling period (in ms). If greater than 0, the command runs in non-blocking mode. Default: 1 ms.trace_size: Maximum data size to collect (in bytes). Tracing stops after the specified amount of data is received. Default: -1 (disabled).stop_tmo: Idle timeout (in sec). Stops tracing if there is no data for the specified period. Default: -1 (disabled).wait4halt: If 0, tracing starts immediately; otherwise, waits for the target to halt before starting. Default: 0.skip_size: Bytes to skip at the start. Default: 0.
Additional information can be found here.
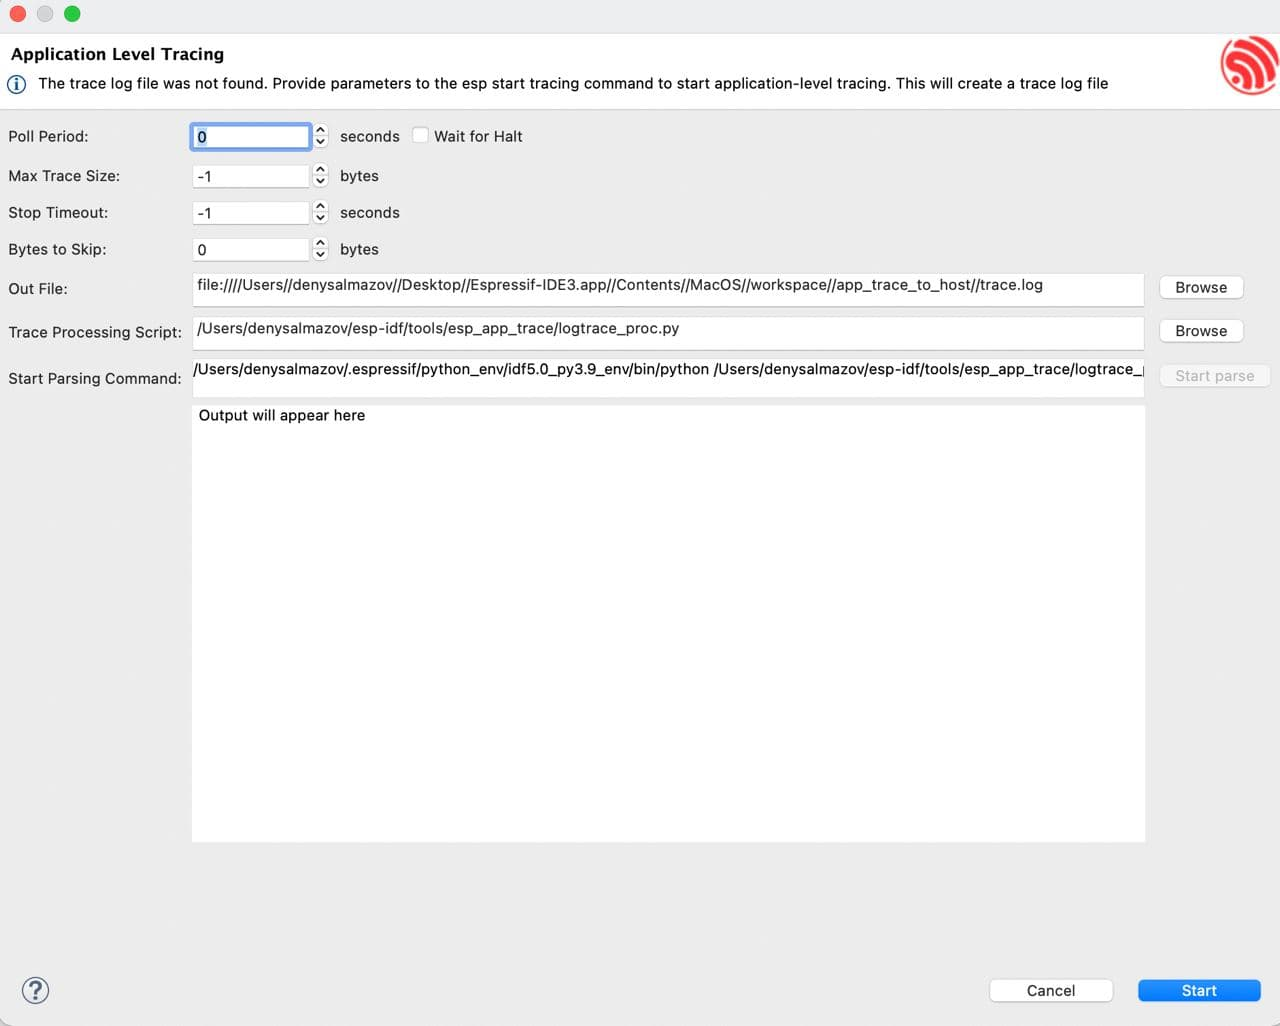
The next two fields, Trace Processing Script and Start Parsing Command, are used to parse the output file.
Trace Processing Script: Path to the parsing script, which by default islogtrace_proc.pyfrom ESP-IDF.Start Parsing Command: Allows you to check and edit the parsing command if necessary. By default, it is configured as:$IDF_PATH/tools/esp_app_trace/logtrace_proc.py/path/to/trace/file/path/to/program/elf/file.
The Start parse button is disabled until a dump file is generated. To generate the dump file, click the Start button at the bottom of the dialog box. This button changes to Stop once tracing starts, allowing you to stop tracing.
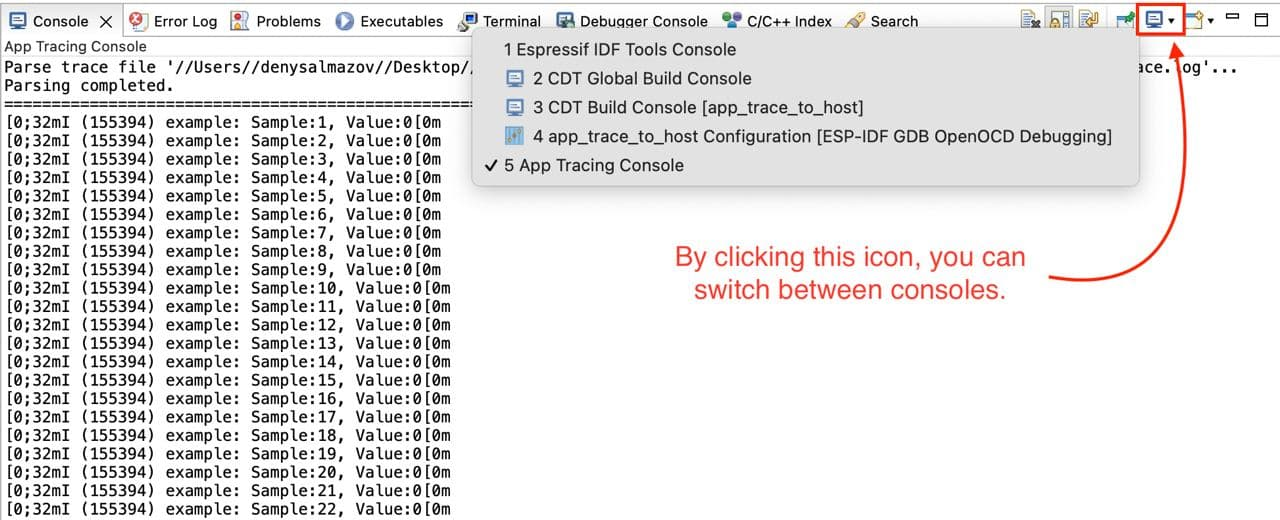
When the output file is available, click Start parse to view the parsed script output in the Eclipse console.
