Heap Tracing
Heap tracing allows you to monitor memory usage over time by generating and analyzing a svdat dump file. The IDF Eclipse Plugin supports generating heap trace files by setting special breakpoints. For more information on SDK-level configuration and tracing features, refer to the official ESP-IDF documentation.
Generating Dump File
Open the sysview_heap_log.c File
From the Project Explorer, locate and open the
sysview_heap_log.cfile from the system templates project.Add a Breakpoint and Configure Properties
Add a breakpoint at the desired line, then right-click on the breakpoint icon in the editor and select
Breakpoint Properties.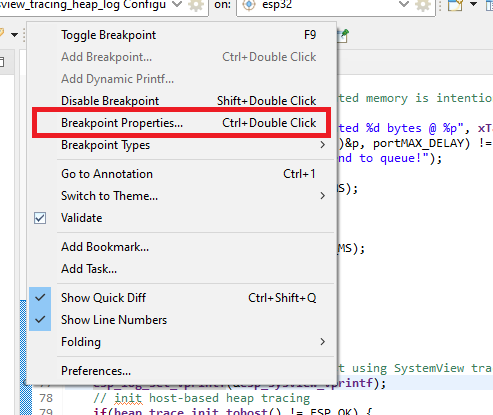
Define Heap Tracing Action
In the
Breakpoint Propertieswindow, go toActions, clickNew, and selectHeap Tracingfrom theAction Typedropdown.For the initial breakpoint, set the
ActiontoStart Heap Traceand specify the save location for the dump file (it is recommended to store it in the project directory). Name the action meaningfully, then clickOK.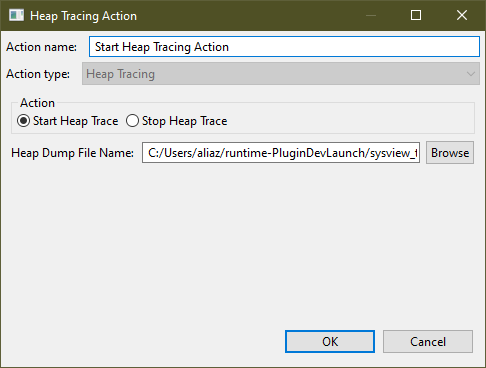
Attach the Action to the Breakpoint
After creating the action, click
Attachto link it to the breakpoint, which will display the action under theActions for this breakpointsection.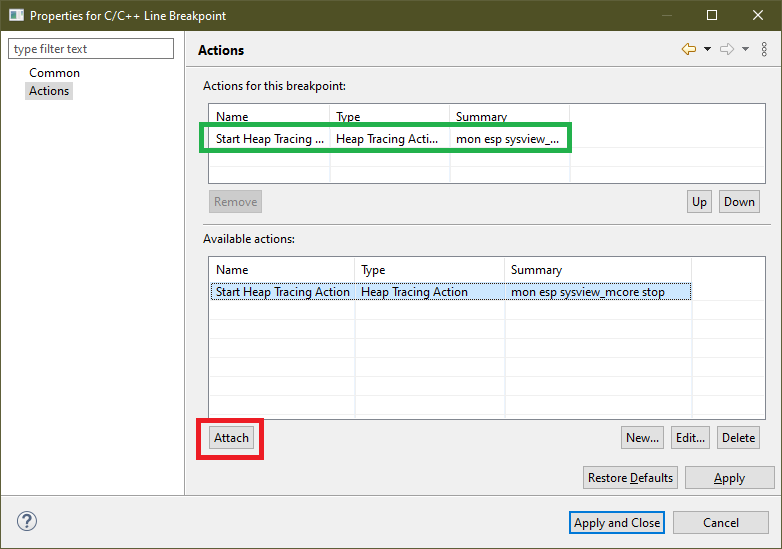
Apply and Create Additional Breakpoint
Now you have a breakpoint that will start tracing and generate a dump file. To stop the tracing, create another breakpoint (e.g., at line 102), set its properties, and choose the
Stop Heap Traceoption in the action settings. Attach this action to the breakpoint as shown below.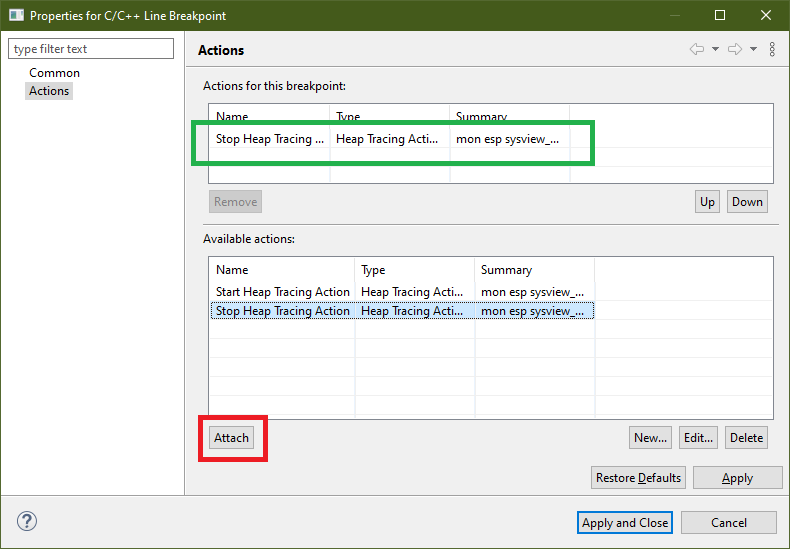
Launch Debug Configuration
Launch the debug configuration for your ESP32 board. When a breakpoint is hit, the IDE will prompt you to switch to the debugger perspective. Continue execution at each breakpoint to start or stop tracing, then refresh the project in the Project Explorer to view the dump file at the specified location.
Analyzing the Dump File
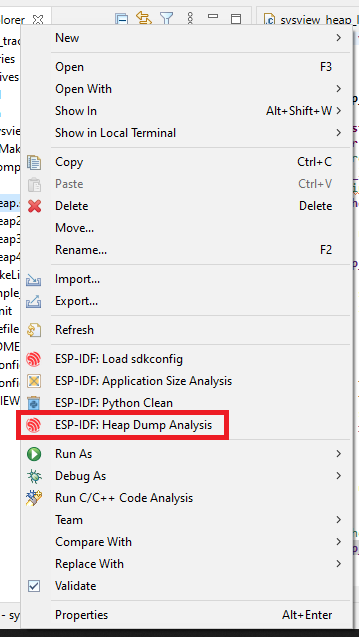
The IDF Eclipse Plugin allows you to analyze generated svdat dump files. Right-click on the dump file and select ESP-IDF: Heap Dump Analysis from the context menu.
Note
Ensure the project is built with the appropriate symbols file to enable analysis.
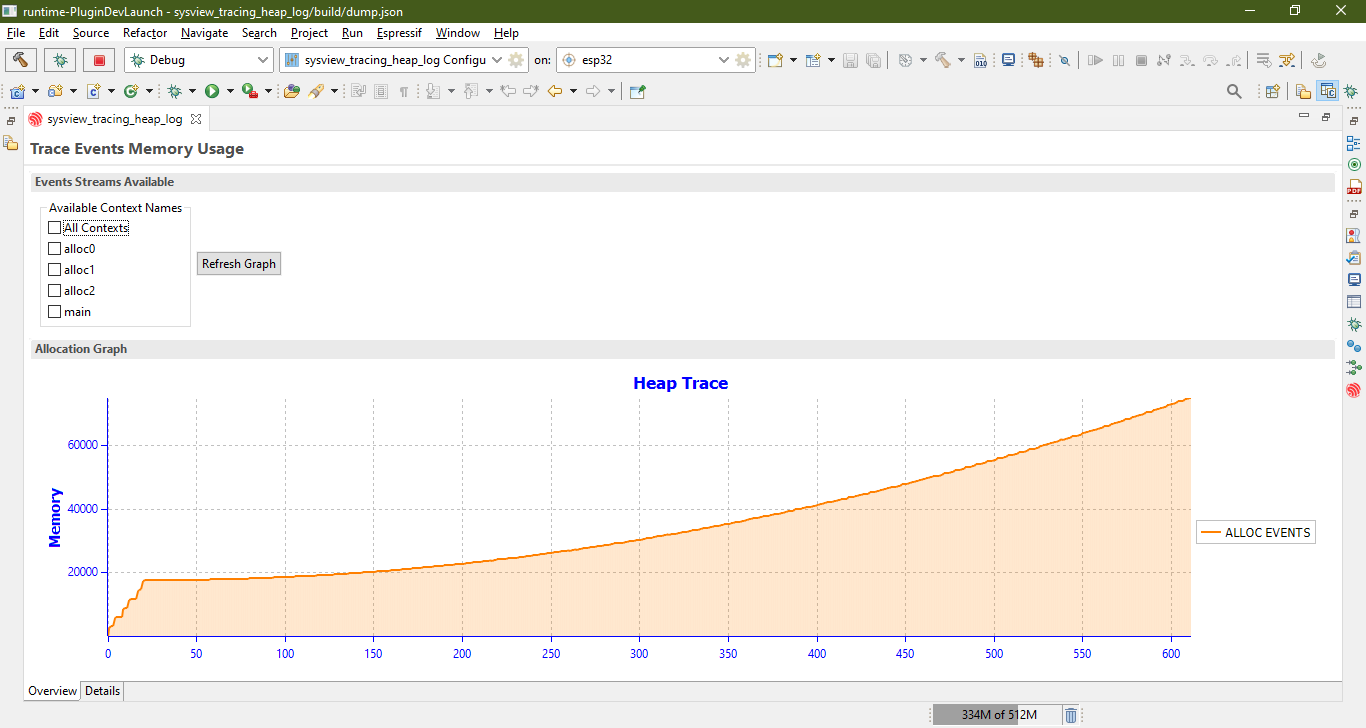
Overview Tab
The Overview Tab displays memory consumption over time in a graph format. By default, all contexts are shown, but you can select specific contexts corresponding to heap events.
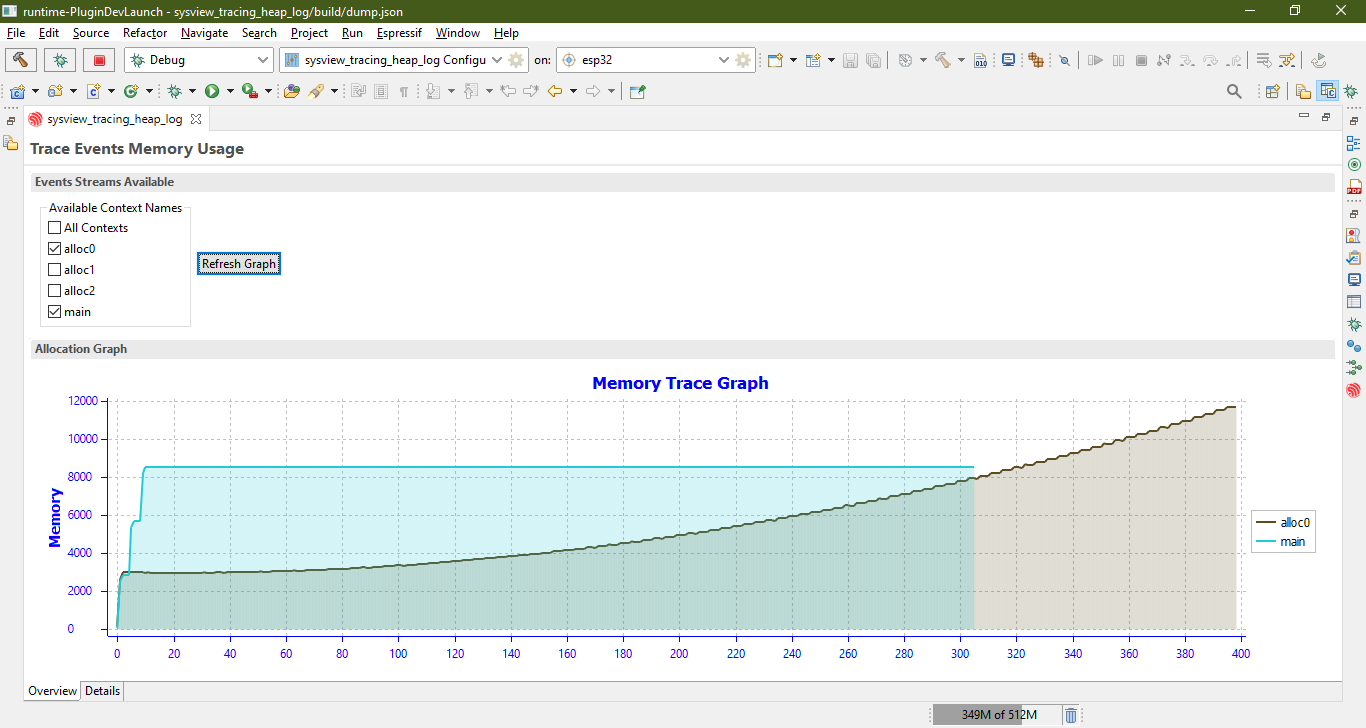
For example, selecting multiple contexts displays each of them separately on the graph.
Details Tab
The Details Tab provides further insights by showing each event in the heap trace. Rows highlighted in light orange indicate potential memory leaks, as the trace may have ended before a corresponding free event was detected. Rows highlighted in green indicate free heap events.
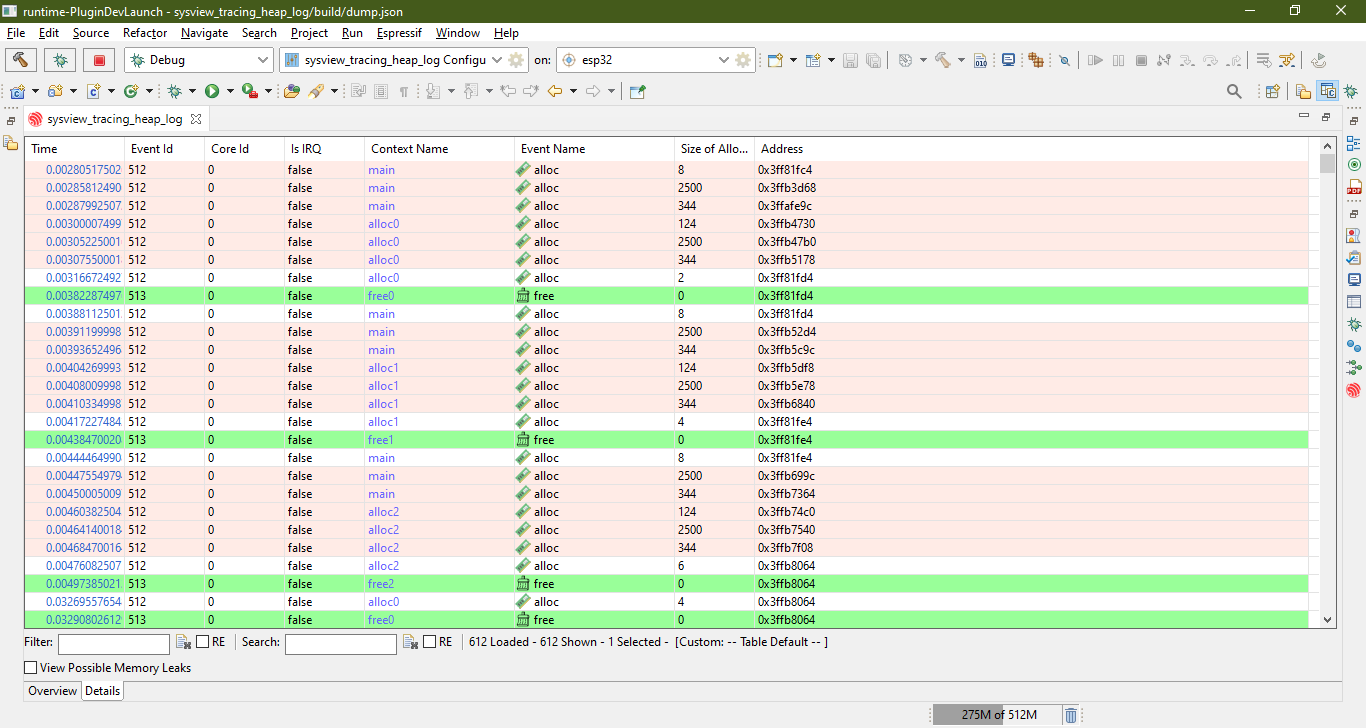
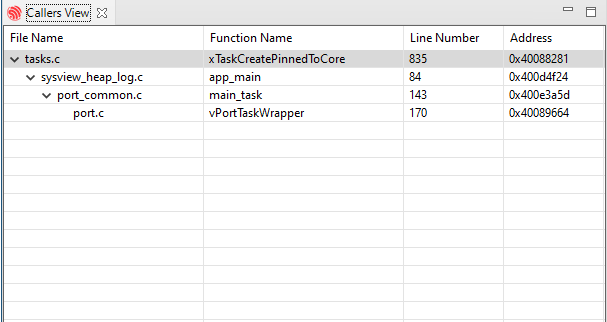
To filter entries for possible memory leaks, check the View Possible Memory Leaks box. Right-clicking on any entry allows you to view its callers by opening the Callers View, which displays the call stack for the heap event.
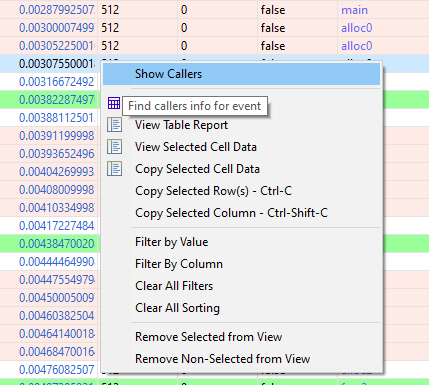
Clicking on an entry in the Callers View will navigate to the corresponding line in the source file.
