Code Coverage
Source code coverage provides data indicating the count and frequency of every program execution path taken during runtime. GCOV is a GCC tool that, when used with the compiler, generates log files showing the execution count of each line of source code.
Your ESP-IDF project should be configured to generate gcda/gcno coverage files using gcov. Please read GCOV Code Coverage to learn more about code coverage with GCOV in ESP-IDF projects.
You can use the ESP-IDF: Configure Project SDKConfig for Coverage to set the required configuration in the SDK Configuration Editor.
Code Coverage Example
Let’s use the ESP-IDF GCOV Example for this tutorial.
Navigate to
View>Command Palette.Type
ESP-IDF: New Projectand choose ESP-IDF version to use.Note
If you don’t see the option, please review the current ESP-IDF setup in Installation.
A window will open with settings to configure the project. Choose from a list of ESP-IDF examples, go to the
systemsection, and selectgcov. You will see aCreate Project Using Example GCOVbutton at the top and a project description below. Configure the project name and directory, clickCreate Projectbutton, wait for the project to be created and then click onOpen Project.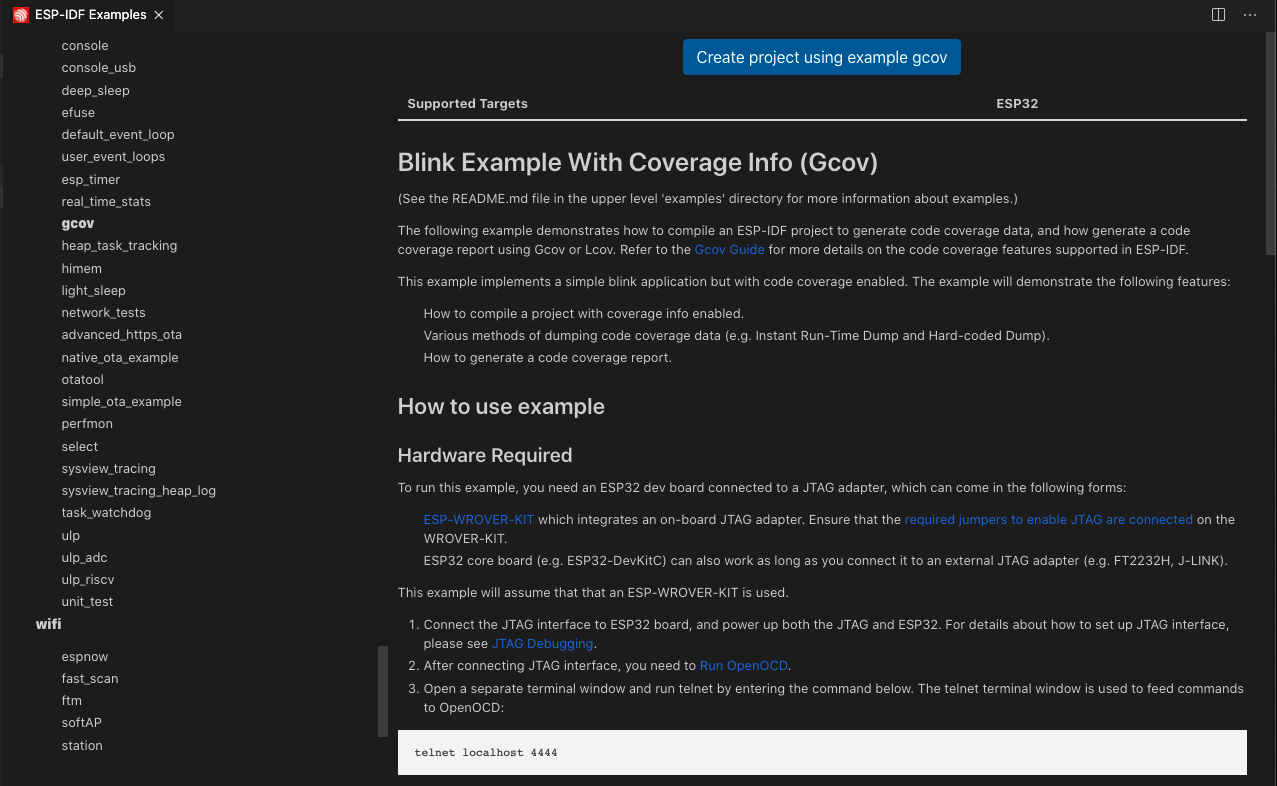
Select a container directory where to copy the example project. For example, if you choose
/Users/myUser/someFolder, the resulting folder will be/Users/myUser/someFolder/gcov. This new project directory will be created and opened in Visual Studio Code.Select an Espressif target (esp32, esp32s2, etc.):
Navigate to
View>Command Palette.Type
ESP-IDF: Set Espressif Device Targetcommand. The default target isesp32, which is used in this tutorial.
Configure your sdkconfig project with the
ESP-IDF: Configure Project SDKConfig for Coveragecommand or manually using theESP-IDF: SDK Configuration Editorcommand. After all changes are made, clickSaveand close the window.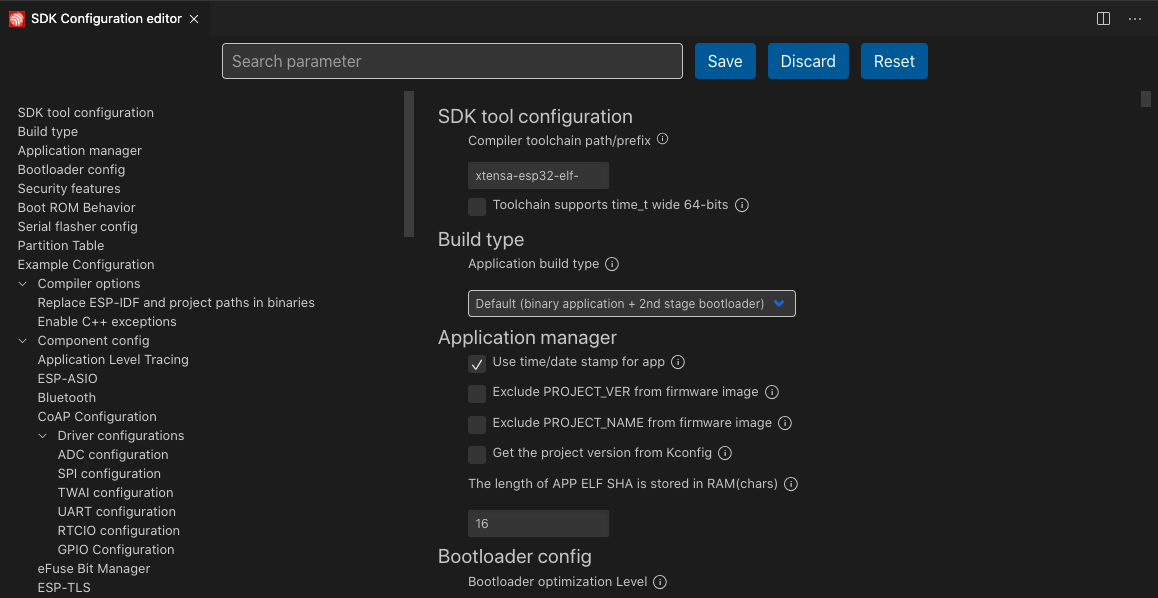
The example will enable the following options by default:
Enable the Application Tracing Module under
Component Config>Application Level Tracing>Data Destinationby choosingTrace Memory.Enable GCOV to host interface under
Component Config>Application Level Tracing>GCOV to Host Enable.Enable OpenOCD Debug Stubs under
Component Config>ESP32-specific>OpenOCD Debug Stubs.
Build the project, flash your device, and start the ESP-IDF Monitor using the
ESP-IDF: Build your Project,ESP-IDF: Flash your Project, andESP-IDF: Monitor Devicecommands.Note
There is also an
ESP-IDF: Build, Flash and Start a Monitor on your Devicecommand that combines all three commands.Launch OpenOCD and send some commands. To start OpenOCD from the extension, execute the
ESP-IDF: OpenOCD Managercommand or use theOpenOCD Server (Running | Stopped)button in the Visual Studio Code status bar. OpenOCD server output is shown inView>Output>ESP-IDF.Launch a new terminal with menu
Terminal>New Terminaland executetelnet <oocd_host> <oocd_port>, which defaults totelnet localhost 4444. Latest macOS users can usenc <oocd_host> <oocd_port>iftelnetis not available.Note
You can modify
openocd.tcl.hostandopenocd.tcl.portconfiguration settings to change these values.Send the OpenOCD command
esp gcov dumpfor a hard-coded dump, which will perform two hard-coded dumps based on this example. Then send theesp gcovcommand for an instant run-time dump.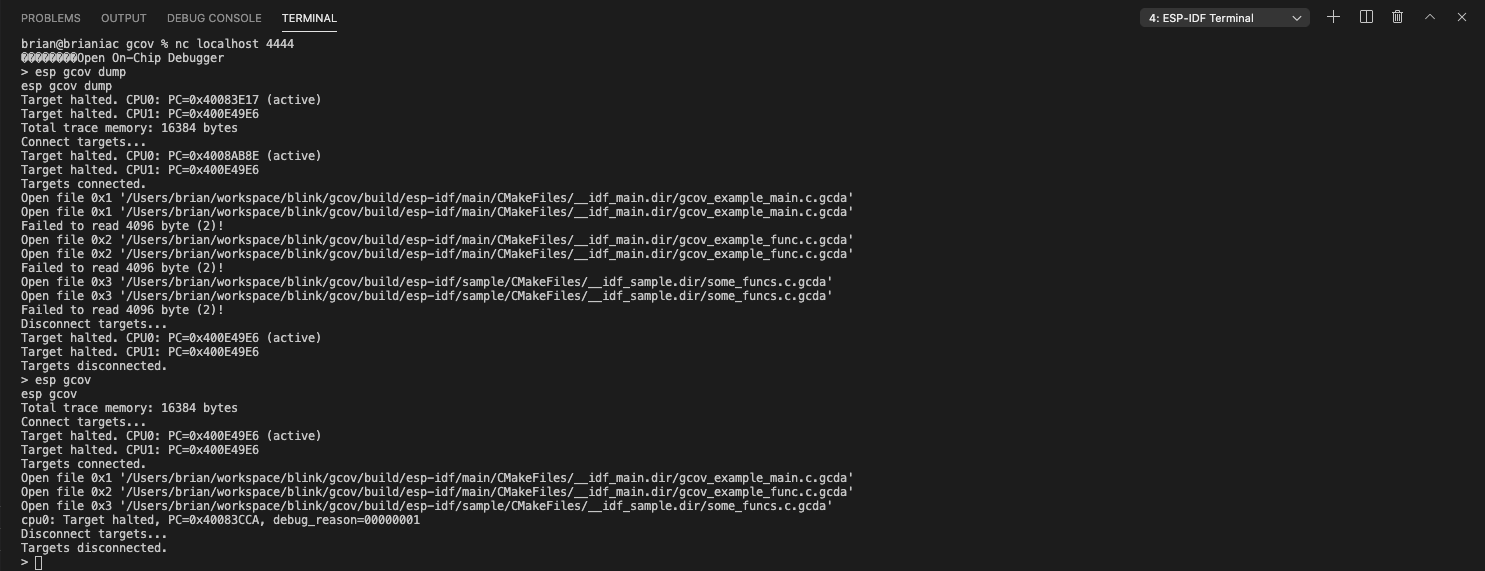
After dumping data, open the desired file in your editor and execute the
ESP-IDF: Add Editor Coveragecommand to highlight the editor with code coverage.You can customize the highlight color through the following configuration settings in the extension’s
settings.jsonfile:Covered lines use
idf.coveredLightThemefor light themes andidf.coveredDarkThemefor dark themes.Partially covered lines use
idf.partialLightThemefor light themes andidf.partialDarkThemefor dark themes.Non-covered lines use
idf.uncoveredLightThemefor light themes andidf.uncoveredDarkThemefor dark themes.
Visual Studio Code supports
red,rgb(255,0,120)orrgba(120,0,0,0.1).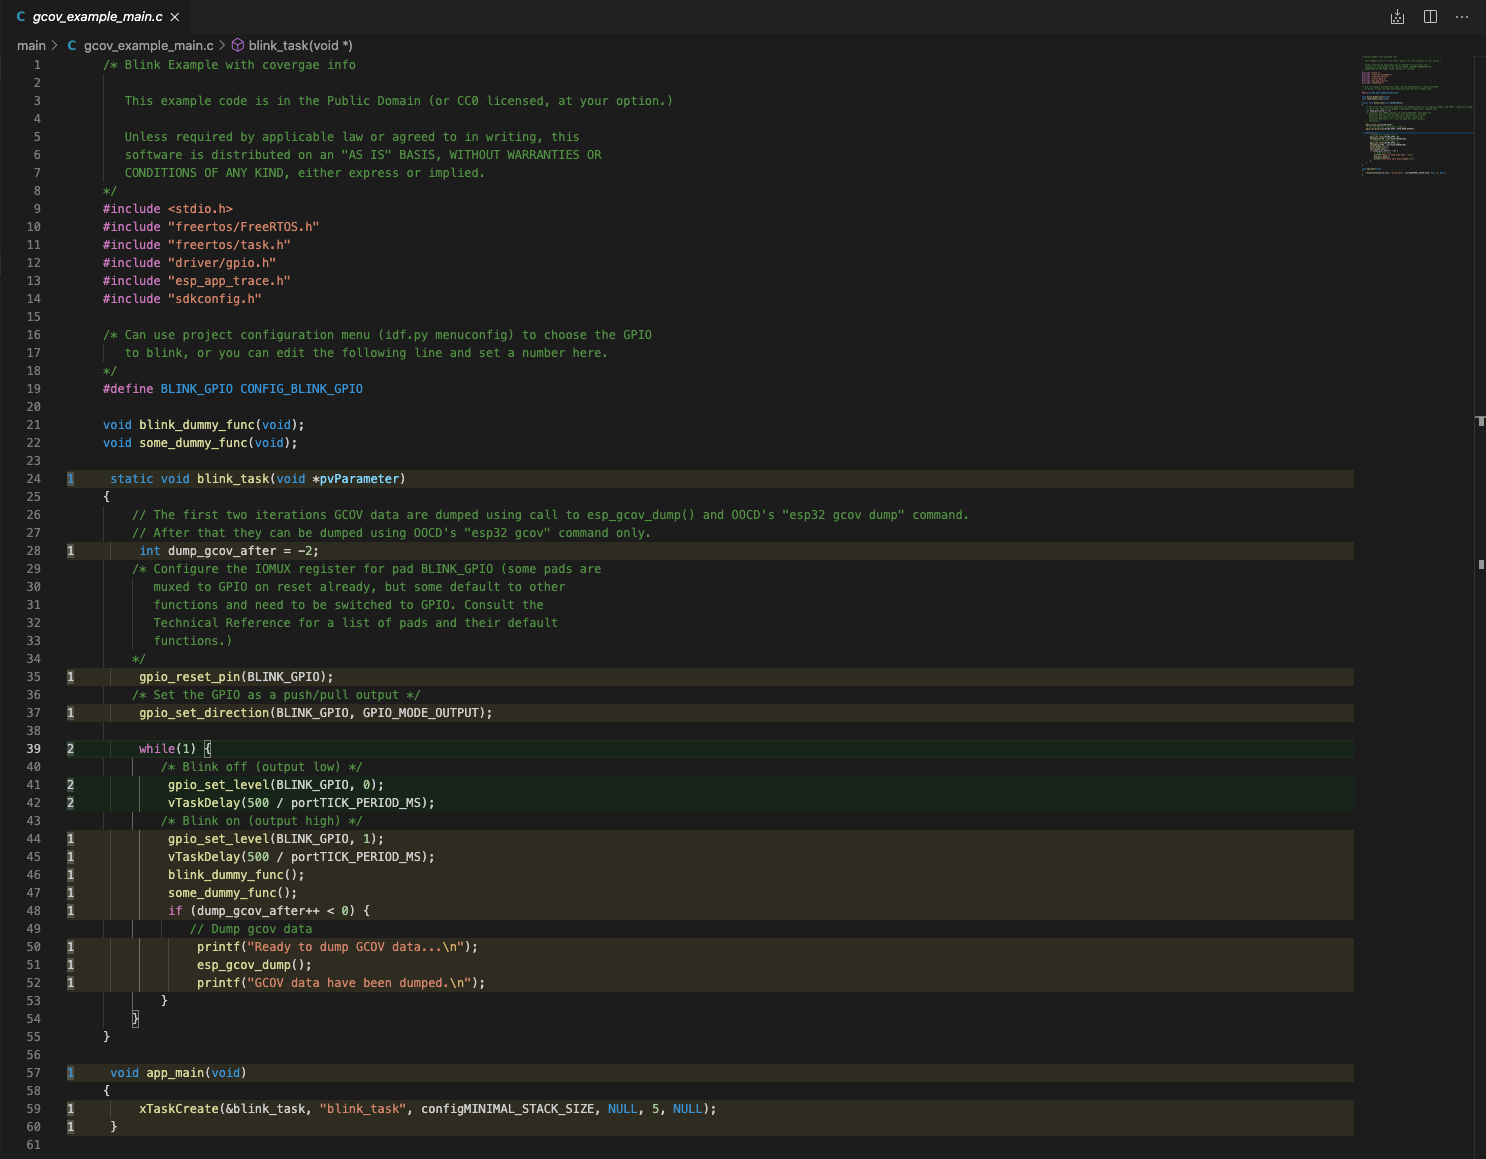
When finished, use the
ESP-IDF: Remove Editor Coveragecommand to remove the code coverage.Navigate to
View>Command Palette.Type
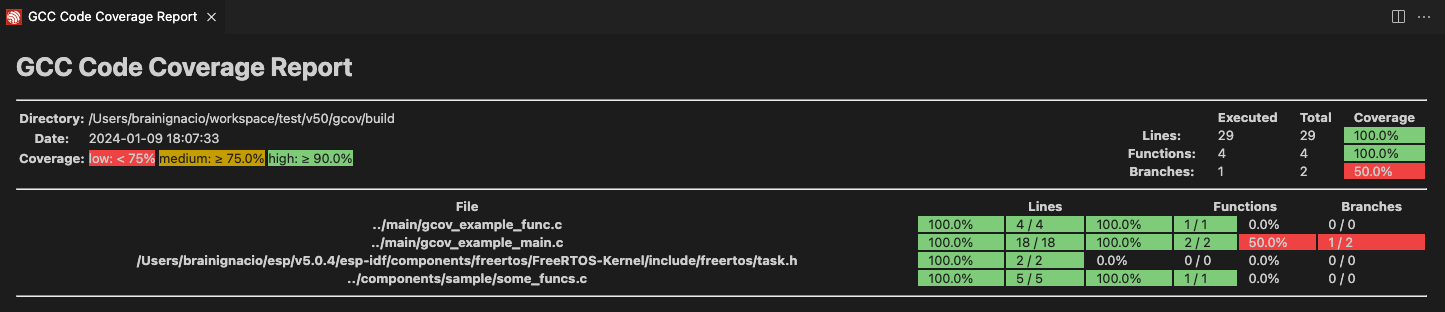
ESP-IDF: Get HTML Coverage Report for Projectand select the command to generate an HTML report for code coverage.
Note
Check the Troubleshooting section if you encounter any issues.