Application Tracing
This feature allows transferring arbitrary data between the host and ESP32 via the JTAG interface with small overhead on program execution.
Developers can use this library to send application-specific state of execution to the host and receive commands or other types of information in the opposite direction at runtime.
Let’s open an ESP-IDF project. For this tutorial, we will use the system/app_trace_to_host example.
Navigate to
View>Command Palette.Type
ESP-IDF: New Project, select the command, and choose the ESP-IDF version to use.Note
If you don’t see the option, please review the setup in Install ESP-IDF and Tools.
A window will open with settings to configure the project. You can later choose from a list of ESP-IDF examples. Go to the
systemsection and chooseapp_trace_to_host. You will see aCreate Project Using Example app_trace_to_hostbutton at the top and a description of the project below. Configure the project name and directory, click theCreate Projectbutton, wait for the project to be created and then click onOpen Project.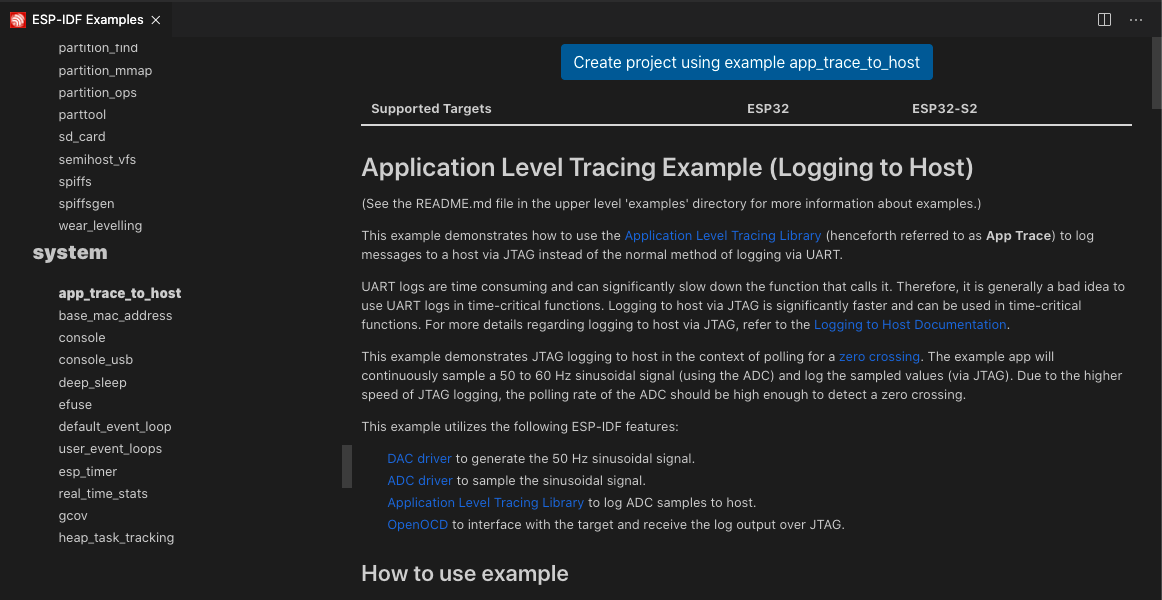
For this example, the project is already configured for application tracing purposes. In other projects, you need to enable
CONFIG_APPTRACE_DEST_TRAXandCONFIG_APPTRACE_ENABLEwith theESP-IDF: SDK Configuration Editorcommand.Configure, build, and flash your project as explained in the Build the project.
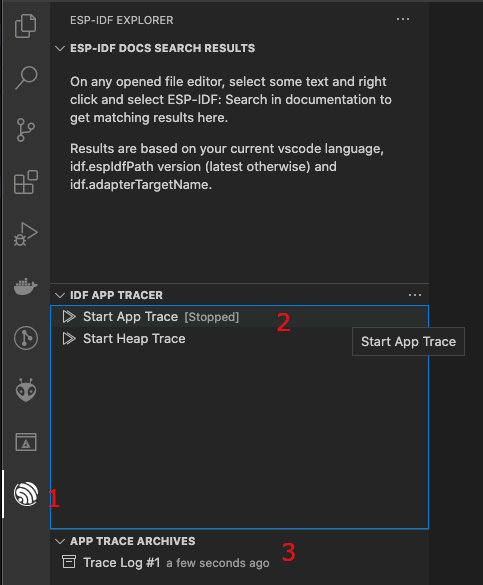
First, click
ESP-IDF Explorerin the Visual Studio Code Activity bar. Second, in theIDF APP TRACERsection, clickStart App Trace. This will execute the extension’s OpenOCD server and send the corresponding tracing commands to generate a tracing log. Third, you can see the generated tracing log in theAPP TRACE ARCHIVESnamedTrace Log #1.Each time you execute
Start App Trace, a new tracing is generated and shown in the archives list. You can also start tracing by running theESP-IDF: App Tracecommand.Note
The OpenOCD server output is shown in menu
View>Output>ESP-IDF.Ensure that OpenOCD configuration files are properly configured with the
ESP-IDF: Select OpenOCD Board Configurationcommand.
Click
Trace Log #1to open a window with the trace report. Click theShow Reportbutton to see the trace output.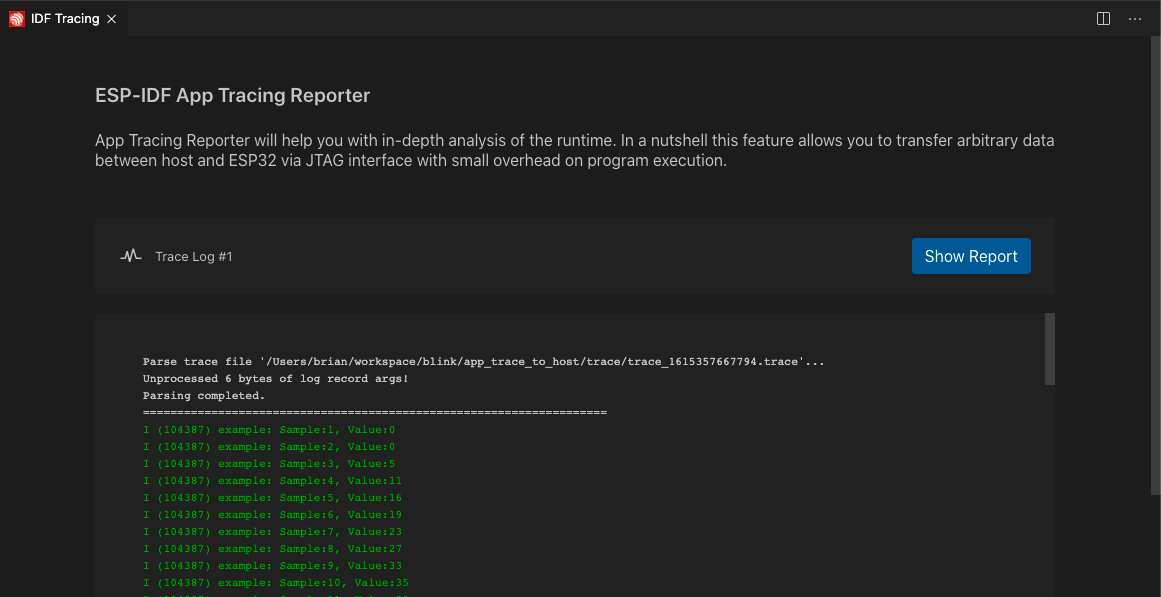
For more information, please refer to Application Level Tracing Library.